
Key Points
In July 2026 the CA-TPU index fell sharply to 95.16, down 35.4% month on month; the three-month moving average (MA3) slipped to 143.32, breaking below the 150 high-pressure threshold. This means that the high-pressure stretch running for four consecutive months from March — the longest since the index began in 2009 — formally came to an end this month. The raw index for July is the lowest reading since January 2025, and also the first fall back below the base-period mean of 100 since February 2025.
The pullback came almost entirely from Uzbekistan: its sub-index plunged from 343.52 to 180.52 (−47.4% month on month), and its contribution share of the composite fell from around three-quarters to around 60%, visibly loosening the “narrow but deep” pattern of the preceding months. The discourse structure turned in step: the “agreement” family collapsed by 75.4%, with sanctions, risk and trade receding alongside it, while law (+82.6%), tax (+64.0%), tariffs (+45.1%) and imports (+24.7%) rose against the trend. The main thread moved from June’s “bargaining over agreements plus sanctions and risk sentiment” into “domestic legislation and the digestion of tariff schedules” — cross-border negotiation language exited the stage, and domestic regulatory topics took over.
1. Index Overview
In July 2026 the CA-TPU raw index was 95.16, down 52.17 points (−35.4%) from June (147.33) and down 17.73 points (−15.7%) from a year earlier (112.89) — the first year-on-year decline since the current tariff war began. The three-month moving average (MA3) registered 143.32, down 17.84 points from June (161.16), ending four consecutive months of the high-pressure state above 150.
Table 1.1 CA-TPU Monthly Comparison
| Indicator | This month (Jul) | Last month (Jun) | MoM change | Year ago | YoY change |
| CA-TPU raw index | 95.16 | 147.33 | −52.17 (−35.4%) | 112.89 | −17.73 (−15.7%) |
| MA3 (moving avg.) | 143.32 | 161.16 | −17.84 (−11.1%) | 112.81 | +30.51 (+27.0%) |
Source: CA-TPU Index Project, based on the monthly release at catpu.caiees.cn.
Two thresholds worth noting were crossed this month. First, the raw index at 95.16 fell back below 100 — that is, below the average level of the 2015–2019 base period — for the first time since February 2025. Second, the MA3 broke below 150, bringing the current high-pressure episode to a close. It should be noted that the MA3 is still up 27.0% year on year, meaning that relative to the same period last year the water level of accumulated discourse pressure remains elevated: this month is “a rapid retreat from a high level,” not “a return to normal.”
2. Historical Context
Placed among the 211 months since 2009, July’s raw index of 95.16 ranks around 122nd, in the lower-middle range of the full history; the MA3 of 143.32 ranks 14th and does not enter the top ten (10th place is the 147.91 of August 2020). The all-time MA3 top-six table therefore remains identical to the previous edition, with 2026 still holding three of the six places (April additionally ranks 7th).
Table 2.1 MA3 All-Time Top 6
| Rank | Month | Raw index | MA3 | Context |
| 1 | 2020-06 | 169.02 | 174.09 | COVID-19 pandemic |
| 2 | 2026-05 | 187.46 | 173.21 | Current (tariff war) |
| 3 | 2026-03 | 183.48 | 166.34 | Current (tariff war) |
| 4 | 2012-09 | 249.81 | 161.40 | Single-month spike |
| 5 | 2026-06 | 147.33 | 161.16 | Current (tariff war) |
| 6 | 2020-05 | 149.90 | 158.32 | COVID-19 pandemic |
Source: CA-TPU Index Project.
The real historical significance of this month lies in the end of the high-pressure episode. Taking MA3 ≥ 150 as the boundary, three high-pressure stretches have occurred since 2009: September–October 2012 (2 months, peak 161.40), May–July 2020 (3 months, peak 174.09), and the current March–June 2026 (4 months, peak 173.21). The current episode set a record for duration, and fell short of the early-COVID peak by less than one point in height. With the MA3 down to 143.32 in July, that record stretch is formally closed.
Judged by the shape of the post-peak retreat, the current downswing has been relatively fast. After the May peak (187.46), the index fell 21.4% in June and a further 35.4% in July, a cumulative drawdown of about 49.2% over two months. By comparison, the cumulative drawdown in the two months after the April 2020 peak was about 16.9%, whereas the single-month spike of September 2012 gave back 83.7% in the very next month. The current episode sits between the two, closer in form to “a surge followed by rapid fading” than to “consolidation at a high level.”
3. Shift in Discourse Structure
The project team tallied, after case-form lemmatisation, the keywords in all “high-value news” in July (articles that simultaneously hit the trade, policy and uncertainty categories) and compared them with June. In both direction and magnitude, this month’s change in discourse structure is the sharpest of the past several months.
Consider first the totals: trade-category frequencies fell from 1,346 to 832 (−38.2%) and uncertainty-category frequencies from 573 to 416 (−27.4%), while the policy category slipped only from 1,209 to 1,128 (−6.7%). In other words, the ebb was concentrated in trade and risk topics, while policy topics essentially held their ground.
Now the structure: every warming lemma family points to domestic regulation — law (закон) up sharply by 82.6% month on month, tax (налог) up 64.0%, tariffs (тариф) up 45.1% and imports (импорт) up 24.7%. The cooling families were precisely June’s protagonists — agreements/treaties (соглашение) collapsed by 75.4%, political (политический) fell 55.4%, sanctions (санкции) fell 52.1%, strategy (стратегия) fell 51.0%, policy (политика) fell 33.0%, risk (риск) fell 30.1% and trade (торговля) fell 28.9%.
Table 3.1 Keyword family MoM change (Jul vs Jun, lemmatised)
| Category | Lemma family | Jul | Jun | MoM |
| P | закон (law) | 210 | 115 | +82.6% |
| P | налог (tax) | 41 | 25 | +64.0% |
| T | тариф (tariffs) | 74 | 51 | +45.1% |
| T | импорт (imports) | 96 | 77 | +24.7% |
| T | торговля (trade) | 246 | 346 | −28.9% |
| U | риск (risk) | 255 | 365 | −30.1% |
| P | политика (policy) | 134 | 200 | −33.0% |
| T | санкции (sanctions) | 81 | 169 | −52.1% |
| T | соглашение (agreement/treaty) | 98 | 399 | −75.4% |
Source: CA-TPU Index Project; frequencies from four-country high-value news, after lemmatisation. Last month’s figures are recomputed on the current corpus snapshot and may differ slightly from the values published in the previous edition (the corpus is updated continuously); the month-on-month comparison is like-for-like within a single snapshot.
The topic-concentration (HHI) of the three categories diverged this month, the opposite of June’s “all three rising in tandem”: trade fell steeply from 658.3 to 477.0, the largest dispersion in six months — the cause being precisely the collapse of the dominant “agreement” family, which scattered trade discourse back across trade, exports, imports, sanctions, tariffs and other directions; policy edged down from 719.2 to 660.9; while uncertainty rose from 1,287.6 to 1,323.2, clustering further around the single “risk” family.
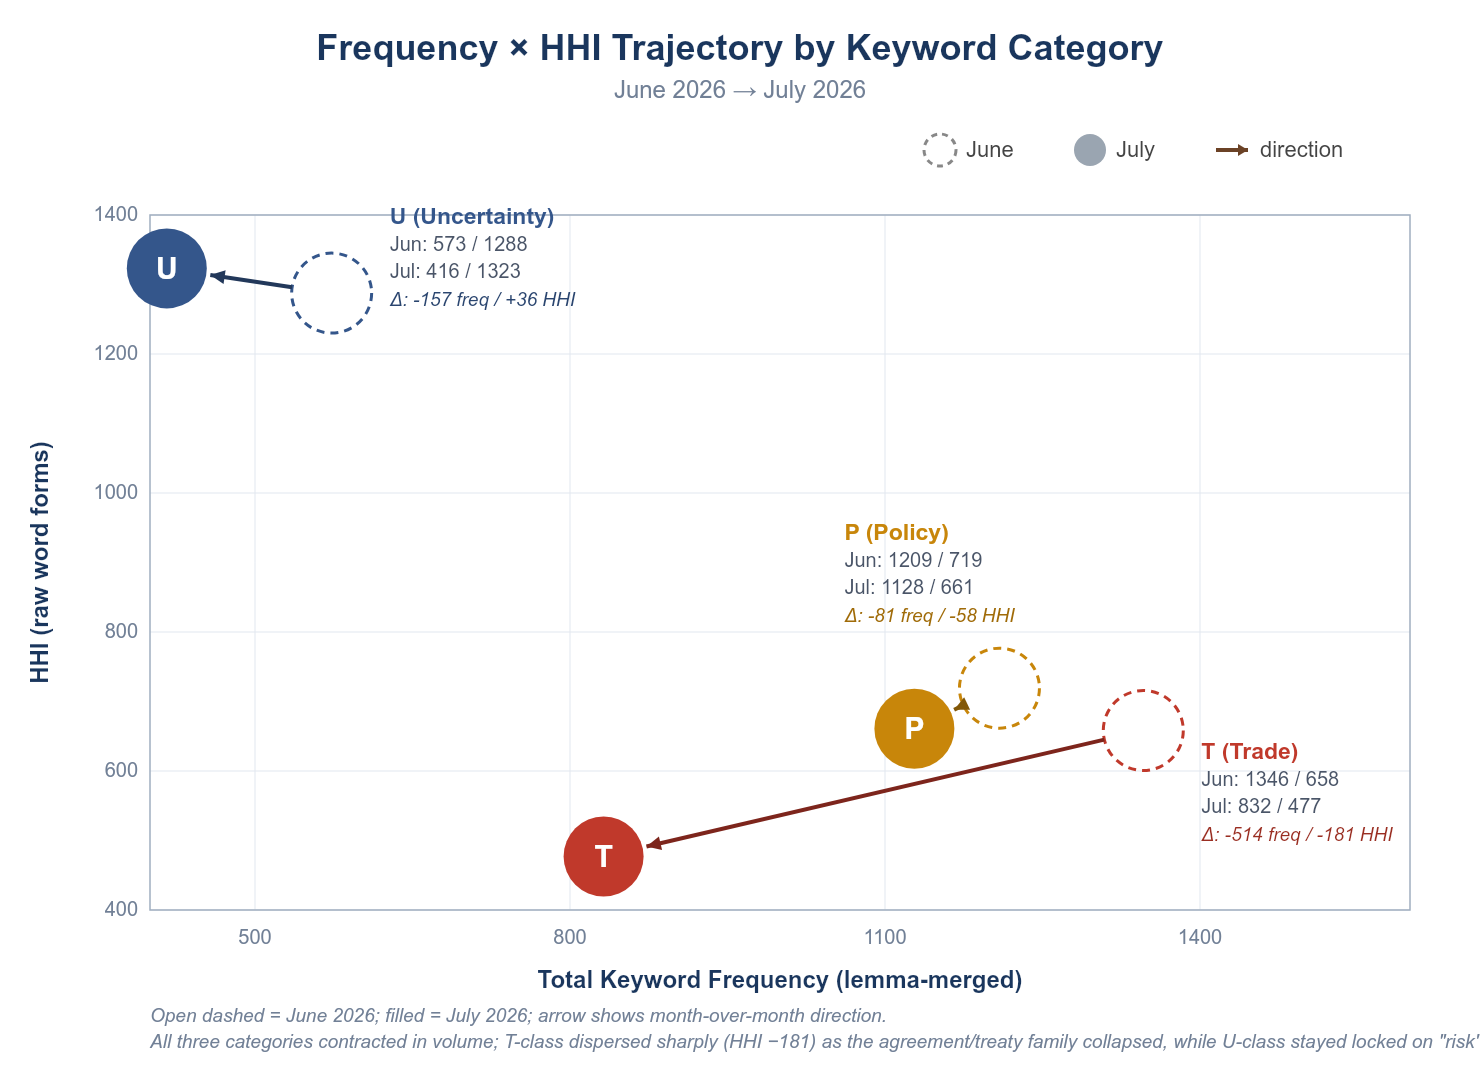
Figure 3.1 Keyword frequency × topic concentration (HHI) trajectory: June → July 2026
The trajectory shows all three categories shifting left in frequency, that is, a broad contraction in total discourse volume. Trade (T) moved the most, its frequency down 514 and its concentration down 181 — a textbook case of “dispersion after the dominant topic disappears”; uncertainty (U) lost 157 in frequency yet saw concentration rise by 36, indicating that the risk discussion that remains is in fact more focused; policy (P) moved least, confirming its status as the “base load” of the discourse.
4. Country Divergence
The CA-TPU index composites four national sub-indices by trade weight (KZ Kazakhstan, UZ Uzbekistan, KG Kyrgyzstan, TJ Tajikistan). The biggest change in the four-country picture this month is that the driving structure shifted from “Uzbekistan dominant” toward relative balance.
Table 4.1 Four-country sub-index trends
| Country | Jul | Jun | MoM | Contribution to composite (Jul) |
| Kazakhstan | 45.51 | 42.26 | +7.7% | about 27.4% |
| Uzbekistan | 180.52 | 343.52 | −47.4% | about 61.2% |
| Kyrgyzstan | 91.14 | 65.98 | +38.1% | about 6.0% |
| Tajikistan | 120.94 | 191.55 | −36.9% | about 5.4% |
Source: CA-TPU Index Project. CA-TPU is a trade-weighted composite of the four countries; weights are based on 2024 trade data, with Kazakhstan around 60% and Uzbekistan around one-third.
On a weighted basis, of the 52.17-point net decline from June, Uzbekistan alone contributed about −52.60 points — the entire source of the pullback; Kazakhstan (about +1.86 points) and Kyrgyzstan (about +1.58 points) rose against the trend and provided a partial offset, while Tajikistan subtracted a further 3.01 points or so. Uzbekistan’s contribution share fell from about 75.2% to about 61.2%: still the largest single source, but markedly less concentrated than before.
It should be noted that the absolute level of Uzbekistan’s sub-index is systematically inflated by sparse base-period samples (see Section 6); its directional change (a sharp pullback this month) can be read normally, but its absolute magnitude should not be over-interpreted.
Table 4.2 Four-country distribution of major keyword families (Jul, lemmatised)
| Cat. | Lemma family | Total | KZ | UZ | KG | TJ |
| P | решение (decisions) | 228 | 110 | 38 | 54 | 26 |
| P | закон (law) | 210 | 160 | 15 | 23 | 12 |
| T | торговля (trade) | 246 | 112 | 77 | 36 | 21 |
| U | риск (risk) | 255 | 130 | 36 | 70 | 19 |
| T | экспорт (exports) | 139 | 49 | 45 | 35 | 10 |
| T | соглашение (agreement/treaty) | 98 | 39 | 17 | 39 | 3 |
| T | санкции (sanctions) | 81 | 12 | 14 | 50 | 5 |
| T | тариф (tariffs) | 74 | 34 | 2 | 34 | 4 |
Source: CA-TPU Index Project; frequencies from four-country high-value news, after lemmatisation.
By country, the centre of gravity of the discourse moved clearly toward Kazakhstan this month. Of the 210 mentions of the “law” family, Kazakhstan alone accounted for 160 (76.2%); it also took 130 of the 255 “risk” mentions (51.0%), 110 of the 228 “decisions” mentions (48.2%) and 112 of the 246 “trade” mentions (45.5%), making it the outright centre of four-country discourse. This is consistent in direction with the modest counter-trend rise in its sub-index (+7.7%) and reflects Kazakhstan turning its attention toward domestic regulation and adjustments to tariff schedules.
Uzbekistan presents a stark contrast: the “agreement” discourse that it single-handedly dominated in June (283 of 381 mentions, 74.3%) shrank abruptly to 17 of 98 mentions (17.3%) this month, with the signs of intensive negotiation all but gone. Kyrgyzstan continues to carry the most concentrated attention to “sanctions” (50 of 81 mentions, 61.7%), consistent with its role in re-export trade and its sensitivity to secondary sanctions; Tajikistan’s small sample base keeps its absolute frequencies generally low, limiting their interpretive value.
5. Outlook and Variables to Watch
Drawing the month’s data together, the following variables are worth tracking through August–September.
First, whether the retreat marks an established trend or an overshoot. This month’s 35.4% month-on-month decline is large by historical standards, and the index has already fallen below the base-period mean. If August stabilises or rebounds modestly and holds around 100, the current discourse shock can be judged to have largely dissipated; if the decline deepens further, attention should turn to whether media attention has shifted wholesale to other themes.
Second, whether the warming of “law / tax / tariffs” can be sustained. The counter-trend rise in this group of lemma families points to the countries converting the results of earlier negotiations into domestic legislation and tariff-schedule adjustments. If it continues through August–September, it means the rules are being implemented, and what firms face will be concrete, actionable compliance changes rather than negotiation rumours.
Third, whether Uzbekistan’s sub-index continues to retreat. This month it fell from 343.52 to 180.52; a further decline into the 100–150 range in August would confirm May’s 472.18 as an extreme single point and mark the definitive end of the “narrow but deep” pattern of the current episode.
Fourth, whether Kazakhstan can hold its position at the centre of the discourse. Although its sub-index remains the lowest of the four (45.51), the country already ranks first in the four major lemma families of law, risk, decisions and trade. As the region’s largest economy, with a trade weight of around 60%, any clear upturn in its sub-index would pull the composite far more strongly than the Uzbekistan-driven moves seen so far.
6. Accompanying Materials
This report is accompanied by two items. The first is the data-transparency package, containing the month-level aggregated data underlying every chart in this report (10 CSV files) and a bilingual data-usage guide, to allow independent verification by third parties. The second is a plain-language brief for businesses and trade practitioners, interpreting the month’s key points and their implications for business practice in non-technical language. The key figures in both are fully consistent with this report.
A note on data vintage: the CA-TPU index series (including the four national sub-indices) follows a “frozen on publication” practice — figures for historical months are not revised retrospectively when the corpus is updated. Corpus diagnostics such as keyword frequencies, topic concentration (HHI) and coverage ratios, by contrast, are recomputed in full on the latest corpus snapshot for each edition, so that comparisons across months within a single edition are like-for-like. The previous month’s diagnostic figures shown in this edition may therefore differ slightly from the values published in the previous edition; this is a normal revision.
On Uzbekistan’s absolute sub-index level: since January 2026 the country’s readings have run persistently high, related to its sample characteristics within the 2015–2019 base period; this is a methodological limitation the project team has identified. For this sub-index, attention should focus on direction and relative trend rather than absolute level. This caveat is kept consistent across the three language editions and the data package.
About the CA-TPU Index
The CA-TPU (Central Asia Trade Policy Uncertainty Index) was developed by the team of Professor Zhang Lijie at the School of Economics and Management, Xinjiang University, built on the economic-policy-uncertainty approach of Baker, Bloom and Davis (2016), covering the main Russian-language media of Kazakhstan, Uzbekistan, Kyrgyzstan and Tajikistan. The index measures the intensity with which these countries’ mainstream media simultaneously discuss trade, policy and uncertainty; the base period is 2015–2019, normalised to a base-period mean of 100, and it is released monthly. Full methodology, historical data and trilingual reports are available at catpu.caiees.cn.
This report is a non-profit academic output, independently funded, and does not constitute investment advice or a basis for business decisions. Attribution: CA-TPU Index Project.