Highlights of the Month
In April 2026, the CA-TPU Index registered 148.68, down 19.0% from the previous month (183.48). However, the three-month moving average (MA3) stood at 157.43, ranking 4th in the entire historical record (after June 2020 at 174.09, March 2026 at 166.34, and September 2012 at 161.40). The data exhibits the classic pattern of “raw index moderating while the moving average remains at historical highs.” The current pressure period (MA3 ≥ 150) has now lasted 3 months, matching the duration of the early COVID-19 pressure period.
By country contribution, Uzbekistan accounted for 71.8% of this month’s CA-TPU composite, the absolute dominant driver. Despite Kazakhstan’s largest trade weight (57.18%), its sub-index TPU was only 49.84, contributing just 19.2%. By topical structure, April’s heating themes were concentrated in two external-trade-confrontation lemma families—”agreement” and “sanctions”—while cooling themes centered on domestic governance words such as “law,” “ministry,” “government,” and “measure.” The P-class (Policy) total frequency contracted by 26.7% month-over-month, while T-class (Trade) remained stable (+4.5%) and U-class (Uncertainty) was essentially flat (-0.1%). The discourse landscape has transitioned from “intense domestic policy response” to “international agreement negotiation and sanctions confrontation.” Topic concentration (HHI) rose across both T and P classes, indicating that fewer issues are being discussed but with greater depth.
- Index Overview
In April 2026, the raw CA-TPU index was 148.68, down 34.80 points from March (183.48), a 19.0% MoM decline; up 30.54 points from the same month last year (118.14), a 25.8% YoY rise. The three-month moving average (MA3) was 157.43, down 5.4% from last month’s 166.34 and up 48.1% YoY versus the 106.32 figure of April 2025.
Table 1.1 CA-TPU Monthly Index Comparison
| Indicator | Apr (current) | Mar | MoM Change | YoY Same Month | YoY Change |
| CA-TPU raw index | 148.68 | 183.48 | -34.80 (-19.0%) | 118.14 | +30.54 (+25.8%) |
| MA3 (moving avg.) | 157.43 | 166.34 | -8.91 (-5.4%) | 106.32 | +51.11 (+48.1%) |
Source: CA-TPU Index Project, based on monthly data published at catpu.caiees.cn.
By zone classification, April’s raw index of 148.68 sits at the upper edge of the 120—150 “moderately elevated” zone, while the MA3 at 157.43 remains in the “significantly elevated” zone above 150. The raw index trails MA3 by -8.75 points—the first “raw index undercutting MA3” signal of 2025 onward. This typically signals short-term retreat from peak intensity but does not yet confirm a medium-term reversal.
- Historical Positioning
2.1 Historical Index Ranking
Placing April’s index in the full record of 208 months since 2009: the raw index 148.68 ranks 15th, while the MA3 of 157.43 ranks 4th. The MA3 ranking is the most striking historical positioning feature this month—even after the raw index sharply pulled back, the smoothed index remains in the historical top 2.0%.
Table 2.1 MA3 Historical TOP10
| Rank | Month | Raw Index | MA3 | Context |
| 1 | 2020-06 | 169.02 | 174.09 | COVID-19 pandemic |
| 2 | 2026-03 | 183.48 | 166.34 | US tariff escalation |
| 3 | 2012-09 | 249.81 | 161.40 | Data-sparse period |
| 4 | 2026-04 (current) | 148.68 | 157.43 | US tariff war |
| 5 | 2020-05 | 149.90 | 158.32 | COVID-19 pandemic |
| 6 | 2020-07 | 141.06 | 153.33 | COVID-19 pandemic |
| 7 | 2012-10 | 40.79 | 151.40 | Data-sparse period |
| 8 | 2020-08 | 133.63 | 147.91 | COVID-19 pandemic |
| 9 | 2015-09 | 146.22 | 144.98 | Tenge free float |
| 10 | 2020-04 | 203.34 | 138.72 | COVID-19 pandemic |
Excluding the data-sparse period of 2012, the MA3 TOP10 contains 5 months from the early COVID-19 era (April–August 2020), with the current tariff war already occupying 2 of the remaining slots (March and April 2026). This means the discourse intensity in March—April 2026 is already at the same order of magnitude as the early COVID-19 period.
2.2 Peak-Retreat Pattern Comparison
Another core feature of this month is the “post-peak retreat.” In the historical record, the CA-TPU raw index has exceeded 170 on six occasions; the distribution of subsequent retreat magnitudes is shown below.
Table 2.2 Subsequent Retreats After Months Where the Raw Index Exceeded 170
| Peak Month | Peak | Next Mo. | Next Δ | M+2 | Background |
| 2012-09 | 249.81 | 40.79 | -83.7% | 44.49 | Data-sparse (low signal) |
| 2015-07 | 176.88 | 111.85 | -36.8% | 146.22 | Tenge free float |
| 2016-07 | 179.45 | 120.77 | -32.7% | 86.22 | Brexit referendum |
| 2020-04 | 203.34 | 149.90 | -26.3% | 169.02 | COVID-19 early |
| 2022-03 | 171.07 | 128.39 | -24.9% | 91.22 | Russia-Ukraine |
| 2026-01 | 175.43 | 140.11 | -20.1% | 183.48 | Tariff war round 1 |
| 2026-03 | 183.48 | 148.68 | -19.0% | (pending) | Tariff war phase 2 |
This month’s retreat magnitude of -19.0% is the mildest “post-peak retreat” in the entire historical record. The closest precedent is the April 2020 → May 2020 -26.3% retreat—the first decline after COVID-19 entered the “adjustment phase,” yet still oscillating at high levels. This month’s retreat is even 7 percentage points milder than April 2020, suggesting the decline is more likely a “short-term consolidation” than a “trend reversal.”
2.3 Persistence of the Pressure Period
Defining a “pressure period” as MA3 ≥ 150, the CA-TPU history contains 2 meaningful pressure periods (excluding the 2012 data-sparse period), plus the one currently in progress.
Table 2.3 MA3 ≥ 150 Historical Pressure Periods
| Start | End | Duration (mo.) | Peak MA3 | Background |
| 2020-05 | 2020-07 | 3 | 174.09 | COVID-19 early |
| 2026-03 | ongoing | ≥3 | 166.34 | current (tariff war) |
Note: The 2012 pressure period (n=2, peak 161.40) is excluded due to limited data quality in the early period.
As of end-April, the current pressure period has lasted 3 months, matching the early COVID-19 pressure period. The COVID-19 pressure period eventually ended in August 2020, primarily driven by the stabilization of “COVID adaptation” discourse (vaccine development, normalized prevention, clearer policy frameworks). The exit conditions for the current pressure period are unclear; possible triggers include explicit US tariff easing, a Central Asia-US tariff exemption agreement, or natural decay of major topic discourse intensity.
- News Data Overview
3.1 News Volume and Coverage Trends
In April 2026, 11,752 news articles were collected from the 8 major media outlets across the 4 countries. Of these, 5,829 were OR-hits (matching at least one of the T/P/U keyword classes) and 297 were AND-hits (matching all three). The f_ratio (AND/OR) was 5.10%, down 0.39 percentage points from March’s 5.49%—consistent with the direction of the raw CA-TPU index decline.
Table 3.1 6-Month News Volume and Three-Class Coverage
| Month | Total | OR-hit | AND-hit | f_ratio % | T cov % | P cov % | U cov % |
| 2025-11 | 3,368 | 2,573 | 119 | 4.62 | 31.18 | 61.73 | 11.28 |
| 2025-12 | 5,754 | 2,957 | 147 | 4.97 | 19.43 | 42.18 | 8.15 |
| 2026-01 | 10,380 | 5,599 | 336 | 6.00 | 20.05 | 44.33 | 9.59 |
| 2026-02 | 10,671 | 5,635 | 267 | 4.74 | 19.03 | 43.11 | 8.72 |
| 2026-03 | 11,386 | 5,648 | 310 | 5.49 | 16.58 | 39.85 | 9.92 |
| 2026-04 | 11,752 | 5,829 | 297 | 5.10 | 18.62 | 39.42 | 8.87 |
Source: news_data2 table query. Coverage = articles containing keywords of that class / total news.
From the 6-month coverage trend, April reveals a noteworthy “scissors gap”: T-coverage (trade topic density) rebounded from March’s 16.58% to 18.62%, while P-coverage (policy topic density) continued to decline from 39.85% to 39.42%. This gap reveals that media attention is shifting from “domestic government policy response” toward “foreign trade dynamics themselves”—possibly reflecting that as the tariff war moves into the operational execution phase, legislative-level policy actions decrease, and specific contracts and goods flows become the new focus. U-coverage slightly declined to 8.87%, consistent with the f_ratio direction.
Note that 2025-11’s coverage (T 31.18%, P 61.73%) is significantly higher than other months, mainly because the news volume (3,368 articles) was only one-third of typical 2026 months. The smaller sample base inflated the coverage rate, so it should not be directly compared with normal 2026 months.
3.2 Topic Concentration (HHI) Changes
The Herfindahl-Hirschman Index (HHI) and TOP5 share are used to measure the concentration of the three keyword classes. Higher HHI and TOP5 share indicate discourse concentrated on fewer core topics.
Table 3.2 T/P/U Topic Concentration Trends (Last 4 Months)
| Month | Class | Distinct kw. | HHI | TOP5 % | TOP10 % |
| 2026-01 | T | 64 | 417.3 | 34.2 | 56.3 |
| 2026-01 | P | 28 | 641.3 | 45.7 | 71.6 |
| 2026-01 | U | 21 | 1066.3 | 61.3 | 91.0 |
| 2026-02 | T | 66 | 444.3 | 37.0 | 57.7 |
| 2026-02 | P | 27 | 663.3 | 47.7 | 73.2 |
| 2026-02 | U | 21 | 1178.3 | 63.9 | 86.8 |
| 2026-03 | T | 61 | 479.2 | 43.6 | 59.1 |
| 2026-03 | P | 27 | 649.5 | 45.5 | 73.9 |
| 2026-03 | U | 20 | 1145.1 | 64.8 | 88.2 |
| 2026-04 | T | 60 | 567.8 | 45.0 | 72.7 |
| 2026-04 | P | 28 | 740.7 | 52.0 | 76.2 |
| 2026-04 | U | 21 | 1187.6 | 65.4 | 90.5 |
HHI formula: Σ(s_i)² × 10000, where s_i is the frequency share of each keyword in the class. Based on raw Russian word forms (no lemma merging) to maintain time-series comparability.
April’s most prominent structural change is the across-the-board rise in topic concentration. T-class HHI rose from 479.2 in March to 567.8 (+18.5%), with TOP5 share rising from 43.6% to 45.0%. P-class HHI rose from 649.5 to 740.7 (+14.0%), with TOP5 share crossing the 50% threshold for the first time (52.0%). U-class HHI rose modestly (1145.1 → 1187.6). This means that although total news volume and OR-hit counts in April were similar to March, the discourse within AND-hit articles has converged significantly toward fewer core issues.
Figure 3.1 Frequency × HHI Trajectory by Keyword Category (March → April)
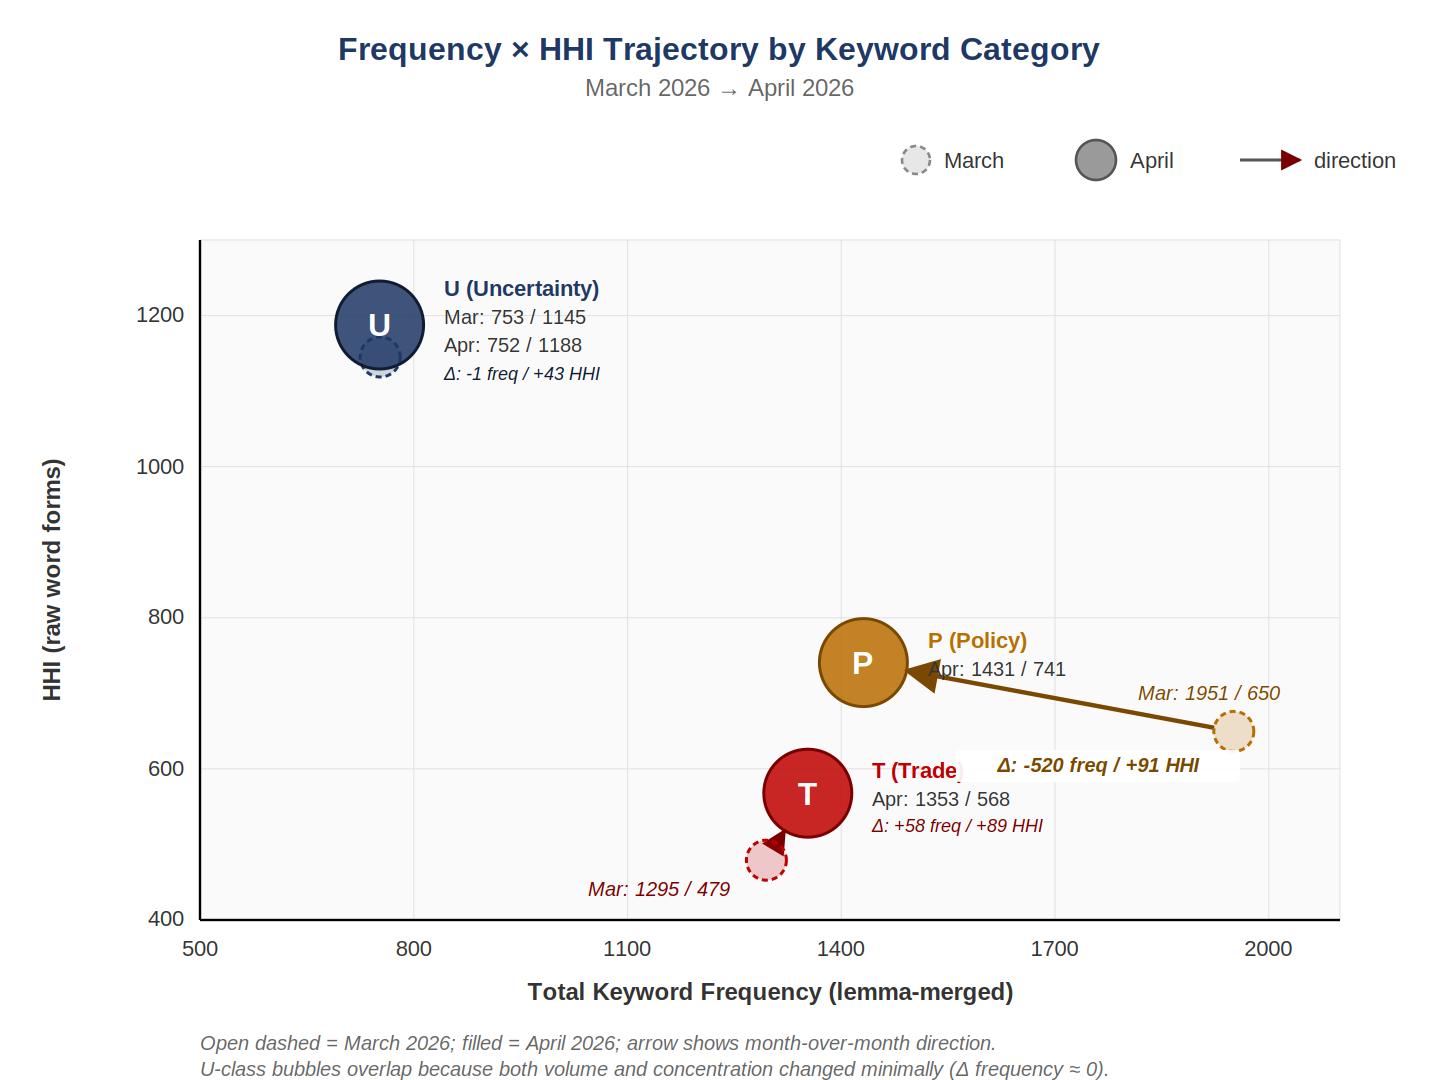
Note: Horizontal axis is total keyword frequency (lemma-merged); vertical axis is HHI (raw word forms, time-series consistent with Table 3.2). Each class has two bubbles—open dashed = March, filled = April—connected by an arrow showing month-over-month direction. P-class shows the most dramatic trajectory (frequency -520, HHI +91, sweeping from lower-right to upper-left), directly visualizing the substantial volume contraction with intensified concentration. T-class shows a small upward arrow (frequency +58, HHI +89), reflecting moderate heating with rising concentration. U-class bubbles overlap in the upper-left (frequency only -1, HHI +43), indicating stable volume with slight concentration gain.
This trajectory distribution provides a mechanism-level explanation for the apparent paradox of “raw index falling but MA3 holding at historical highs”—as topics become more focused, each piece of uncertainty news carries a higher “signal strength,” supporting the smoothed index level. In other words, while April’s uncertainty discourse has shrunk in quantity, it has become more concentrated and directional in quality. The P-class trajectory is particularly noteworthy—although class volume contracted by nearly 30%, the residual discourse concentrated further on core policy words like “decision” and “policy,” indicating that while the dense government policy responses of March have receded, a few core policy issues continue to be discussed. T-class shows the “volume up and more focused” pattern, foreshadowing the “agreement” and “sanctions” twin themes elaborated below.
- Driver Analysis
4.1 Country Contribution: Uzbekistan’s Absolute Dominance
Decomposing CA-TPU by country, the April per-country TPU and weighted contributions are as follows.
Table 4.1 Per-Country TPU Trends (Last 6 Months and YoY Same Month)
| Month | KZ | UZ | KG | TJ | CA-TPU composite |
| 2025-04 | 113.62 | 150.52 | 67.12 | 71.83 | 118.14 |
| 2025-11 | 113.36 | 144.94 | 90.58 | 92.68 | 119.22 |
| 2025-12 | 55.37 | 194.68 | 81.85 | 195.92 | 100.13 |
| 2026-01 | 63.30 | 394.43 | 95.33 | 140.05 | 175.43 |
| 2026-02 | 49.98 | 311.71 | 77.07 | 143.25 | 140.11 |
| 2026-03 | 44.49 | 434.24 | 89.14 | 288.69 | 183.48 |
| 2026-04 | 49.84 | 330.72 | 97.94 | 171.31 | 148.68 |
Table 4.2 April Country Contribution Decomposition
| Country | Trade Weight | Apr TPU | Weighted Contribution | Share |
| Kazakhstan (KZ) | 0.5718 | 49.84 | 28.50 | 19.2% |
| Uzbekistan (UZ) | 0.3227 | 330.72 | 106.72 | 71.8% |
| Kyrgyzstan (KG) | 0.0628 | 97.94 | 6.15 | 4.1% |
| Tajikistan (TJ) | 0.0427 | 171.31 | 7.31 | 4.9% |
| Total | 1.0000 | — | 148.68 | 100.0% |
Weighted contribution = country TPU × country weight. Share = weighted contribution / CA-TPU composite.
April’s per-country TPUs are highly differentiated. Kazakhstan’s TPU at 49.84 is far below the base mean of 100, up only 12.0% from March’s 44.49. Kyrgyzstan’s TPU at 97.94 is up 9.9% from March—both contribute limitedly to the composite. Uzbekistan’s TPU at 330.72 fell 23.8% from March’s 434.24; Tajikistan’s TPU at 171.31 fell 40.7% from March’s 288.69. By share contribution, Uzbekistan dominates with 71.8%, while Kazakhstan—despite the highest trade weight (57.18%)—contributes only 19.2%.
Comparing April with the same month last year (2025-04) reveals the structural reversal more clearly: in 2025-04, KZ contributed 53.8% and UZ contributed 40.2%—roughly balanced; in 2026-04, KZ plummeted to 19.2% and UZ surged to 71.8%. This structural reversal has held throughout 2026, with Uzbekistan’s contribution share remaining above 70% since January 2026. The MoM decline of -19.0% in April was primarily driven by Uzbekistan (-23.8%) and Tajikistan (-40.7%), while KZ and KG sub-indices actually rose modestly.
It must be noted that Uzbekistan’s TPU has remained above 300 since January 2026, which admits two possible explanations: (i) a real structural increase in UZ’s f_ratio in 2026 (driven by tariff-war-related trade policy reporting); (ii) statistical amplification due to UZ’s relatively small standard deviation of f_ratio in the 2015—2019 base period (data-sparse era). The CA-TPU project team is evaluating the v8 robustness improvements; see Section 6 for a detailed methodological discussion.
4.2 Keyword Frequency Evolution: Structural Topic Shift
Comparing keyword frequencies in April’s AND-hit articles (those simultaneously matching all three classes and contributing to TPU) with March, after lemma-merging Russian keywords (consolidating all case-form variants of the same root into a single lemma family), aggregate changes by class are: T-class total frequency (high-frequency families with ≥30 combined) rose from 1,295 in March to 1,353 in April, a 4.5% increase; P-class fell sharply from 1,951 to 1,431, a 26.7% decline; U-class slipped marginally from 753 to 752, a 0.1% decline. The asymmetric divergence across classes clearly reveals: T-class (trade) density rose moderately, P-class (policy) density contracted dramatically, and U-class (uncertainty) was overall flat.
The dramatic P-class contraction is April’s most important structural finding. All major policy lemma families showed double-digit declines: “law” (закон family) plunged from 321 to 124 (-61.4%), “ministry” (министерство family) fell from 254 to 135 (-46.9%), “government” (правительство family) fell from 274 to 165 (-39.8%), “measure” (мера family) fell from 220 to 143 (-35.0%), “reform” (реформа family) fell -20.5%. The dense “government action and legislative response” narrative concentrated in March has almost wholly receded in April.
In contrast, T-class heating is sharply focused on just two lemma families: “agreement” (соглашение family) jumped from 169 to 312 (+84.6%), and “sanctions” (санкции family) jumped from 117 to 211 (+80.3%). These two families together added a net 237 mentions, single-handedly supporting T-class’s overall 4.5% rise and partially offsetting the declines in “trade,” “export,” “contract,” and other trade words.
Table 4.3 Top 10 Heating Keywords (April vs March, lemma-merged)
| Class | Keyword Family | Mar Freq. | Apr Freq. | Δ | Δ % |
| T | соглашение (agreement) | 169 | 312 | +143 | +84.6% |
| T | санкции (sanctions) | 117 | 211 | +94 | +80.3% |
| U | риск (risk) | 420 | 440 | +20 | +4.8% |
| P | налог (tax) | 21 | 37 | +16 | +76.2% |
| U | кризис (crisis) | 126 | 134 | +8 | +6.3% |
| P | политика (policy) | 221 | 224 | +3 | +1.4% |
| T | импорт (import) | 101 | 103 | +2 | +2.0% |
| T | тариф (tariff) | 63 | 62 | -1 | -1.6% |
| U | неопределенность (uncertainty) | 42 | 40 | -2 | -4.8% |
| P | стратегия (strategy) | 108 | 105 | -3 | -2.8% |
Only families with combined frequency ≥30 are included. All Russian case-form variants are merged within each family.
Table 4.4 Top 10 Cooling Keywords (April vs March, lemma-merged)
| Class | Keyword Family | Mar Freq. | Apr Freq. | Δ | Δ % |
| P | закон (law) | 321 | 124 | -197 | -61.4% |
| P | министерство (ministry) | 254 | 135 | -119 | -46.9% |
| P | правительство (government) | 274 | 165 | -109 | -39.8% |
| P | мера (measure) | 220 | 143 | -77 | -35.0% |
| T | торговля (trade) | 446 | 375 | -71 | -15.9% |
| T | экспорт (export) | 274 | 214 | -60 | -21.9% |
| T | договор (contract/treaty) | 125 | 76 | -49 | -39.2% |
| P | реформа (reform) | 73 | 58 | -15 | -20.5% |
| U | нестабильность (instability) | 71 | 57 | -14 | -19.7% |
| U | напряженность (tension) | 94 | 81 | -13 | -13.8% |
The contrast between heating and cooling lists reveals the substantive structural transformation in April’s discourse. Heating themes are concentrated in two families—”agreement” and “sanctions”—jointly contributing 237 net mentions. These two families form the “external shock and confrontation” discourse type, characterized by international negotiations, bilateral/multilateral games, and external pressure. Cooling themes concentrate on another set—”law,” “ministry,” “government,” “measure,” “reform,” all of P-class. The “law” family alone shed 197 mentions, equivalent to 83% of the entire net gain in agreement+sanctions. These together form the “domestic governance” discourse type, characterized by government proactive action, legislative response, and internal coordination.
The substance of this shift is that the tariff war has moved from the January–March phase of “governments announcing response packages, legislatures rushing to follow up” into the phase of “specific agreement negotiation and sanctions enforcement landing.” In the prior phase, news discourse naturally concentrated on government, law, ministry, and measure; in the latter phase, discourse turns to specific agreement clauses, sanctions lists, and tariff schedules. From a signal perspective, this transition means the source of uncertainty has shifted from “can domestic policies be issued?” to “can international consensus be reached?”—the latter typically lasting longer and exhibiting greater external dependency.
4.3 Country Topic Specialization
Cross-tabulating April’s main lemma-merged keyword families across countries reveals clear topic specialization.
Table 4.5 4-Country Distribution of Main Keyword Families (April, lemma-merged, total ≥60)
| Class | Family | Total | KZ | UZ | KG | TJ |
| U | риск (risk) | 440 | 221 | 97 | 93 | 29 |
| P | решение (decision) | 378 | 133 | 163 | 69 | 13 |
| T | торговля (trade) | 375 | 109 | 149 | 78 | 39 |
| T | соглашение (agreement) | 312 | 56 | 213 | 27 | 16 |
| P | политика (policy) | 224 | 89 | 91 | 29 | 15 |
| T | экспорт (export) | 214 | 73 | 94 | 35 | 12 |
| T | санкции (sanctions) | 211 | 26 | 94 | 90 | 1 |
| P | правительство (government) | 165 | 60 | 83 | 16 | 6 |
| P | мера (measure) | 143 | 53 | 56 | 21 | 13 |
| P | министерство (ministry) | 135 | 32 | 61 | 29 | 13 |
| U | кризис (crisis) | 134 | 59 | 38 | 23 | 14 |
| P | закон (law) | 124 | 30 | 55 | 29 | 10 |
| P | стратегия (strategy) | 105 | 39 | 58 | 6 | 2 |
| T | импорт (import) | 103 | 44 | 24 | 28 | 7 |
| U | напряженность (tension) | 81 | 21 | 36 | 17 | 7 |
| T | договор (contract) | 76 | 33 | 28 | 12 | 3 |
| T | тариф (tariff) | 62 | 41 | 5 | 15 | 1 |
Bolded values indicate the highest frequency among the four countries for that family. Given different total news volumes (KG ≈ 55% of UZ; TJ ≈ 25% of KZ), relative concentration is more diagnostic than absolute frequency.
The four countries’ discourse landscapes show striking differentiation.
Kazakhstan’s media concentrates on “risk” discourse—of the 440 mentions of the “risk” family, KZ accounts for 221 (relative concentration 50.2%, nearly double its share of news volume)—exhibiting the classic “passive defensive” narrative: extensive reporting on “risks emerging,” “risks intensifying,” “risk assessment,” yet light on specific response measures. KZ media’s other distinguishing feature is the high concentration of “tariff” discourse: of 62 “tariff” mentions, KZ holds 41 (66.1%), far exceeding its news volume share. This reflects KZ’s heightened sensitivity—as Central Asia’s largest economy—to US tariff transmission effects.
Uzbekistan’s media concentrates on “agreement, decision, policy, trade” discourse, particularly with UZ holding 213/312 (68.3%) of the “agreement” family—the classic “active response” narrative: extensive reporting on agreement negotiations, government decisions, policy measures. This aligns with UZ’s recent push for regional trade facilitation and multilateral economic cooperation, and explains why UZ’s TPU has stayed at the top of the four Central Asian countries throughout 2026.
Kyrgyzstan’s most striking feature is the extreme concentration of “sanctions” discourse—the family’s 211 total includes 90 from KG (42.7%), nearly matching UZ’s 94, despite KG’s total news volume being only ~55% of UZ. This anomalous concentration has a clear background: KG hosts substantial Russia-Russia transit trade in recent years, making it highly sensitive to US “secondary sanctions” risk. The implication for KG market is that April–May is a high-frequency window for secondary sanctions risk to materialize.
Tajikistan’s frequencies are uniformly low across all high-frequency families, with limited discourse capacity. Its contribution to the composite mainly arises from statistical amplification of its sub-index TPU absolute level.
Country topic specialization has important implications for interpreting CA-TPU. Kazakhstan’s low TPU and high “risk” discourse are not contradictory—risk is identified but AND-hits are scarce, meaning these risk discussions are not yet linked to specific policy actions or trade events. Uzbekistan’s high TPU and high “agreement, policy” discourse are highly aligned, reflecting strong three-way coupling among policy, trade, and uncertainty in UZ media. Kyrgyzstan’s low TPU paired with high “sanctions” discourse concentration flags a potential transmission risk—if secondary sanctions materialize, KG’s TPU could exhibit non-linear escalation.
- Trend Observations
5.1 Comparison with Historical Analogues
Comparing this month’s operating characteristics with historical analogues, May 2020 (the early COVID-19 post-peak retreat month) emerges as the strongest analogue. Both occurred in the month after a historical peak (April 2020 peak 203.34, March 2026 peak 183.48); both retreat magnitudes are in the “mild” tier (-26.3% and -19.0%); both MA3 levels enter historical TOP6 (excluding the data-sparse early period); both pressure period durations (3 months in early COVID, 3 months currently) match closely.
However, two key differences distinguish 2020 and 2026. First, the 2020 peak was an instantaneous shock from COVID (exogenous event); after the peak, the shock entered an “adaptation phase” with naturally declining discourse intensity. The 2026 tariff war is a persistent policy negotiation process, lacking a “clear shock-resolution signal,” so whether the retreat persists depends on negotiation progress. Second, in the 2020 pressure period, topic concentration changed without a clear direction; this month sees comprehensive concentration increases (HHI rising sharply in T and P classes), with discourse converged onto two main lines—”agreement” and “sanctions”—meaning any progress (positive or negative) in either of these lines will significantly impact the index. From these two points, the 2026 pressure period evolution path is unlikely to mechanically follow 2020—the key variable now is the international agreement negotiation pace, not the “digestion time” for a single shock.
5.2 Pressure Period Persistence
The current pressure period (MA3 ≥ 150) has lasted 3 months, matching the early COVID-19 pressure period. But the “exit conditions” differ. The COVID pressure period ended in August 2020, primarily driven by the stabilization of “COVID adaptation” discourse. The current pressure period’s exit conditions remain unclear; possible triggers include explicit US tariff easing, a Central Asia-US tariff exemption agreement, or natural decay in the major discourse threads.
From the April features—comprehensive HHI rise and convergence onto agreement+sanctions twin lines—the current pressure period exit is more likely to depend on substantive breakthroughs in core issues than on natural discourse decay. In other words, if no substantive progress on key issues (especially agreement negotiations) emerges in coming months, CA-TPU is highly likely to remain in the MA3 ≥ 150 high-pressure zone.
5.3 Variables to Monitor
From a data perspective, the following variables warrant focused monitoring in the next stage. First, whether the “agreement” family continues to scale up—if frequency continues rising, it implies a new round of bilateral negotiations is intensifying, possibly the main driver in the next 1–2 months. If the family retreats while the “sanctions” family rises, it signals negotiation breakdown moving toward sanctions hedging. Second, whether the high concentration of “sanctions” discourse in Kyrgyzstan spreads to other countries, especially Kazakhstan—if KZ’s sanctions discourse rises significantly, it may presage US secondary sanctions transmission to Central Asia’s largest economy. Third, whether Uzbekistan’s TPU absolute level returns toward historical means—330.72 remains markedly elevated; UZ’s base-period standard deviation amplification effect (see Section 6) bears watching. Fourth, whether the T-coverage vs P-coverage scissors gap persists—if T-coverage stays above P-coverage, the discourse landscape has entered the “policies issued, trade reacts” stage, with more direct enterprise-level implications. Fifth, whether P-class discourse rebounds in a new form—April’s near-total recession of policy discourse does not mean policy response is over; if a new round of policy responses emerges (especially in reaction to negotiation outcomes or sanctions lists), P-class will rise again, and the overall discourse pressure will form a triple stack of “agreement + sanctions + policy.”
- Methodological Notes
6.1 On Uzbekistan TPU Anomaly
This report’s Uzbekistan TPU has stayed above 300 since January 2026. This is a known issue identified in the current methodology, awaiting evaluation. Its root cause: the standardization step (Y_{c,t} = f_{c,t} / σ_c) uses each country’s f_ratio standard deviation in the 2015–2019 base period as denominator. UZ has a relatively sparse sample in the base period, leading to a small σ_c and statistical amplification of subsequent Y_ct values.
The project team’s handling principles: First, openly acknowledge this limitation and avoid over-interpreting UZ’s absolute sub-index level. Second, UZ’s directional changes (heating/cooling) and relative trend remain valid—this month’s UZ -23.8% retreat from March is a genuine directional signal. Third, while CA-TPU composite is influenced by UZ’s high level, since UZ has only 32% weight (not dominating), it still reflects regional uncertainty changes faithfully. The forthcoming v8 version will evaluate the robustness of using longer baselines, rolling baselines, or alternative standardization methods.
6.2 Russian Keyword Lemma-Merge Methodology
This month’s report applies lemma-merge processing to Russian keywords. The method uses root-prefix matching to consolidate all case-form variants of the same root into a single lemma family. For example, the “law” family includes закон (nominative), закона (genitive), закону (dative), законы (plural), and all other variants under the unified label закон (law). This processing has critical importance for interpreting true keyword discourse intensity—without merging, the discourse intensity of a single family is scattered across multiple variants, masking genuine heating or cooling signals.
As evidence: this month’s “risk” family, after merging, shows April 440 vs March 420—only a slight 4.8% increase. But looking at only the genitive form “риска,” April 67 vs March 33 would falsely indicate +103% heating. Lemma-merging eliminates this kind of statistical artifact caused by case-form fragmentation. It must be noted that the HHI calculation (Table 3.2) remains based on raw word-form data to maintain time-series comparability—merging would significantly change HHI absolute levels and break comparability with historical months. A future full switch to merged HHI is planned as part of v8 methodology, with all historical months backfilled and released as a single update.
- Data Appendix
Appendix Table A.1 CA-TPU Index 13-Month Time Series
| Month | Raw Index | MA3 | n_countries |
| 2025-04 | 118.14 | 106.32 | 4 |
| 2025-05 | 117.71 | 112.58 | 4 |
| 2025-06 | 107.84 | 114.56 | 4 |
| 2025-07 | 112.89 | 112.81 | 4 |
| 2025-08 | 113.70 | 111.48 | 4 |
| 2025-09 | 132.84 | 119.81 | 4 |
| 2025-10 | 124.98 | 123.84 | 4 |
| 2025-11 | 119.22 | 125.68 | 4 |
| 2025-12 | 100.13 | 114.78 | 4 |
| 2026-01 | 175.43 | 131.60 | 4 |
| 2026-02 | 140.11 | 138.56 | 4 |
| 2026-03 | 183.48 | 166.34 | 4 |
| 2026-04 (current) | 148.68 | 157.43 | 4 |
Appendix Table A.2 April T/P/U Keyword Families (AND-hits, lemma-merged)
| Class | Lemma Family | Frequency | Rank in Class |
| T | торговля (trade) | 375 | 1 |
| T | соглашение (agreement) | 312 | 2 |
| T | экспорт (export) | 214 | 3 |
| T | санкции (sanctions) | 211 | 4 |
| T | импорт (import) | 103 | 5 |
| T | договор (contract/treaty) | 76 | 6 |
| T | тариф (tariff) | 62 | 7 |
| T | пошлина (duty/tariff) | 9 | 8 |
| T | таможня (customs) | 7 | 9 |
| T | ВТО (WTO) | 6 | 10 |
| P | решение (decision) | 378 | 1 |
| P | политика (policy) | 224 | 2 |
| P | правительство (government) | 165 | 3 |
| P | мера (measure) | 143 | 4 |
| P | министерство (ministry) | 135 | 5 |
| P | закон (law) | 124 | 6 |
| P | стратегия (strategy) | 105 | 7 |
| P | политический (political) | 62 | 8 |
| P | реформа (reform) | 58 | 9 |
| P | налог (tax) | 37 | 10 |
| P | законодательство (legislation) | 8 | 11 |
| U | риск (risk) | 440 | 1 |
| U | кризис (crisis) | 134 | 2 |
| U | напряженность (tension) | 81 | 3 |
| U | нестабильность (instability) | 57 | 4 |
| U | неопределенность (uncertainty) | 40 | 5 |
| U | турбулентность (turbulence) | 12 | 6 |
| U | недоверие (distrust) | 11 | 7 |
Source: news_data2 table query, restricted to 2026-04-01 through 2026-04-30, AND-hits (rand IS TRUE), four countries combined; Russian keyword case-form variants merged into lemma families.
- Data Transparency Package
To enhance the readability and verifiability of this report, the CA-TPU Index Project releases a companion data transparency package alongside this monthly report (CA-TPU_Datapackage_202604). Readers can independently inspect and cite all quantitative conclusions in this report based on the 10 CSV datasets in the package, without accessing the source database.
This package is positioned as a “transparency supplement” rather than a “complete audit dossier.” For data security and project intellectual property protection, the package does not disclose the CA-TPU Index’s internal data architecture, query code, or core computational implementation. For methodological details, please contact the project team via catpu.caiees.cn for academic collaboration.
8.1 Package Contents
The package is organized into two sub-directories:
data/ — 10 CSV datasets, the source data for all quantitative conclusions in this report, including: the CA-TPU full 209-month time series, per-country TPU sub-index trends, news volume and three-class coverage for the past 6 months, MA3 historical TOP10, post-peak retreat distribution, MA3 pressure period identification, topic concentration HHI and TOP5 share, lemma-merged keyword frequency MoM, April keyword TOP15 by class, and the April distribution of main keyword families across the four countries;
guide/ — bilingual data package usage guide (Chinese/English). The data_dictionary_CN.md and data_dictionary_EN.md files describe which CSV corresponds to each section/table of the report, the meaning and units of each column, and how to open and read the data with Excel, WPS, or Python pandas. The lemma_glossary_CN.md and lemma_glossary_EN.md files list the semantic scope of the 29 core lemma families across T/P/U classes used in this month’s report, but do not disclose specific consolidation rules or dictionary implementation.
8.2 Usage Recommendations
First, readers are advised to read the data_dictionary (Chinese or English) first to understand the mapping between CSVs and report sections. Second, the CSVs use UTF-8 encoding and can be opened directly with Excel, WPS, LibreOffice Calc, or Python pandas. Third, when citing any data in your own analysis, please include the attribution “Source: CA-TPU Index Project / April 2026 Data Transparency Package.” Fourth, for the semantic boundaries of Russian keyword lemma families (e.g. “agreement,” “sanctions”), refer to lemma_glossary.
8.3 Data Use License
This data transparency package is released under CC BY-NC 4.0 — free for academic research and teaching with proper attribution (CA-TPU Index Project, School of Economics and Management, Xinjiang University), not for commercial use. For data issues or further collaboration, please submit feedback via the project homepage catpu.caiees.cn.
- Companion Brief Reading Recommendation
This monthly report serves as the academic and policy-analysis vehicle for the CA-TPU Index, prioritizing methodological rigor, data completeness, and historical positioning. Considering different readers’ focal points, the CA-TPU Index Project simultaneously releases a companion plain-language brief: “Central Asia Trade Policy Risk Quick Read · April 2026 · A Concise Edition for Trade Practitioners”.
The plain-language brief draws on exactly the same underlying data as this deep version but adjusts narrative and structure in three respects:
First, narrative focus shifts from “index operating mechanisms” to “specific implications for enterprise practice.” Topics like MA3 historical positioning, HHI concentration, and UZ statistical amplification—central to the deep version—are replaced with practitioner-relevant questions: “what really happened in April,” “the substance of the storm,” “four-country differences,” and “observation points for the next 1–2 months.”
Second, the country section unfolds in dedicated subsections. The brief gives an independent paragraph to each of Kazakhstan, Uzbekistan, Kyrgyzstan, and Tajikistan, providing three layers of information per country—”risk temperature,” “narrative main thread,” and “implications for enterprise practice.” Examples include recommendations to proactively review long-term contract terms with UZ partners during May, immediate compliance audits for KG-routed transit trade against secondary sanctions risk, and noting that the “risk narrative” intensity is eroding decision-making sentiment among KZ clients.
Third, writing style shifts from academic report to concise narrative for trade practitioners. Technical terms (HHI, f_ratio, σ_c, Y_ct) are avoided, while core trade-relevant concepts (“agreement negotiation,” “sanctions confrontation,” “secondary sanctions”) are retained. Three red-bordered, light-yellow callout boxes highlight the most actionable insights for enterprises.
The project team recommends —
Trade industry practitioners working on Central Asia (especially in enterprise risk management, overseas business, cross-border settlements, and compliance/legal roles) should read both documents in tandem: first the brief to acquire a holistic sense of April’s discourse landscape and four-country differences, then return to this deep version to look up methodology and historical positioning for issues of interest. The two documents complement each other and can together build a fairly complete understanding of April 2026 Central Asia trade policy uncertainty within 20 minutes.
Academic researchers, regulators, and policy analysts may rely primarily on this deep version and the data transparency package described in Section 8, focusing on methodology reproducibility, the handling of UZ statistical amplification, and the impact of keyword lemma-merging on discourse structure identification.
About the CA-TPU Index
CA-TPU (Central Asia Trade Policy Uncertainty Index) is developed by Professor Zhang Lijie’s team at the School of Economics and Management, Xinjiang University. Built on the methodology proposed by Baker, Bloom & Davis (2016), it covers Kazakhstan, Uzbekistan, Kyrgyzstan, and Tajikistan, with data starting January 2009. For detailed methodology, historical index data, and quarterly/monthly report downloads, please visit catpu.caiees.cn.
This report is published by the CA-TPU Index Project. The index is for academic research and informational reference only, and does not constitute investment advice or business decision basis.