
Key Points
In June 2026 the CA-TPU index eased from May’s near-record high to 147.33, a 21.4% decline month on month; yet its three-month moving average (MA3) still registered 161.16, remaining above 150 — the high-pressure zone — for the 4th consecutive month (March–June). This is the longest high-pressure stretch since the index began in 2009 (the previous record was three months during the early COVID period of 2020). This month’s MA3 also entered the all-time top ten for the first time (5th), with 2026 alone now holding four of the top ten places.
The pullback came almost entirely from Uzbekistan, whose sub-index fell from May’s extreme reading (472.18) to 343.52; even so it still accounts for about three-quarters of the composite and remains the absolute dominant force. In contrast to the index’s decline, the discourse structure showed a marked reversal from May: the “agreement/treaty,” “sanctions,” “risk” and “policy” families rose sharply in frequency (the agreement family up 42.7% month on month), while the “trade,” “exports,” “tariff” and “decision” families receded. The main thread swung back from May’s “concrete trade instruments” toward “bargaining over agreements plus sanctions and risk sentiment” — pressure rotated from the operational layer back to the bargaining layer.
1. Index Overview
In June 2026 the CA-TPU raw index was 147.33, down 40.13 points (−21.4%) from May (187.46) and up 39.49 points (+36.6%) from a year earlier (107.84). The MA3 registered 161.16, down 12.05 points from May (173.21), yet remaining in the high zone above 150 for a fourth consecutive month.
Table 1.1 CA-TPU Monthly Comparison
| Indicator | This month (Jun) | Last month (May) | MoM change | Year ago | YoY change |
| CA-TPU raw index | 147.33 | 187.46 | −40.13 (−21.4%) | 107.84 | +39.49 (+36.6%) |
| MA3 (moving avg.) | 161.16 | 173.21 | −12.05 (−7.0%) | 114.56 | +46.60 (+40.7%) |
Source: CA-TPU Index Project, based on the monthly release at catpu.caiees.cn.
In contrast to May, when the raw index surged well above the MA3, June saw the raw index (147.33) fall back below the MA3 (161.16), turning the gap negative and signalling that single-month discourse intensity has clearly cooled from its peak. But the MA3’s decline (−12.05) was far smaller than that of the raw index (−40.13), so the high-pressure state persisted — precisely the role of a moving average in “shaving peaks and filling valleys” to identify trend: a single month’s pullback is not yet enough to reverse four months of accumulated pressure.
2. Historical Context
Placed among the 210 months since 2009, the June MA3 of 161.16 ranks 5th in the entire history, so the current tariff-war episode now occupies three of the six highest MA3 readings (May, March, June); extended to the top ten, it holds four (including April). More notable is the duration: the high-pressure state (MA3 ≥ 150) has now lasted four consecutive months (March–June), surpassing the three months of the early-COVID period in 2020 to become the longest high-pressure stretch since the index began.
Table 2.1 MA3 All-Time Top 6
| Rank | Month | Raw index | MA3 | Context |
| 1 | 2020-06 | 169.02 | 174.09 | COVID-19 pandemic |
| 2 | 2026-05 | 187.46 | 173.21 | Current (tariff war) |
| 3 | 2026-03 | 183.48 | 166.34 | Current (tariff war) |
| 4 | 2012-09 | 249.81 | 161.40 | Single-month spike |
| 5 | 2026-06 | 147.33 | 161.16 | Current (tariff war) |
| 6 | 2020-05 | 149.90 | 158.32 | COVID-19 pandemic |
Source: CA-TPU Index Project.
This month’s historical significance lies not in the single-month reading (147.33 ranks only around 20th all-time) but in the “sustained pressure” captured by the MA3: four consecutive months of discourse pressure that has never occurred in the past 17 years. This means that even as single-month discourse intensity eases, the cumulative depth of the policy uncertainty driven by the current tariff war has already exceeded that of the early COVID period.
3. Shift in Discourse Structure
The project team tallied, after case-form lemmatisation, the keywords in all “high-value news” in June (articles that simultaneously hit the trade, policy and uncertainty categories) and compared them with May. The June discourse structure showed a marked reversal from May.
The warming lemma families were concentrated in bargaining over agreements, sanctions and risk language: agreements/treaties (соглашение) up sharply by 42.7% month on month, policy (политика) up 27.8%, sanctions (санкции) up 26.6% and risk (риск) up 13.8%. The cooling families were precisely May’s protagonists — concrete trade instruments: tariffs (тариф) down 37.2%, exports (экспорт) down 32.1%, trade (торговля) down 24.2% and decisions (решение) down 17.6%.
Table 3.1 Keyword family MoM change (Jun vs May, lemmatised)
| Category | Lemma family | Jun | May | MoM |
| T | соглашение (agreement/treaty) | 381 | 267 | +42.7% |
| P | политика (policy) | 184 | 144 | +27.8% |
| T | санкции (sanctions) | 162 | 128 | +26.6% |
| U | риск (risk) | 347 | 305 | +13.8% |
| P | решение (decisions) | 244 | 296 | −17.6% |
| T | торговля (trade) | 332 | 438 | −24.2% |
| T | экспорт (exports) | 150 | 221 | −32.1% |
| U | кризис (crisis) | 65 | 96 | −32.3% |
| T | тариф (tariffs) | 49 | 78 | −37.2% |
Source: CA-TPU Index Project; frequencies from four-country high-value news, after lemmatisation.
The topic-concentration (HHI) of the three categories rose in tandem this month, the opposite of May’s dispersion: trade rose sharply from 507.7 to 666.0 (the largest gain), policy rose from 690.5 to 714.5 and uncertainty rose from 1187.1 to 1299.0. Rising concentration means discourse is converging on a few topics — trade is highly focused on “agreement,” and uncertainty is focused further on “risk.”
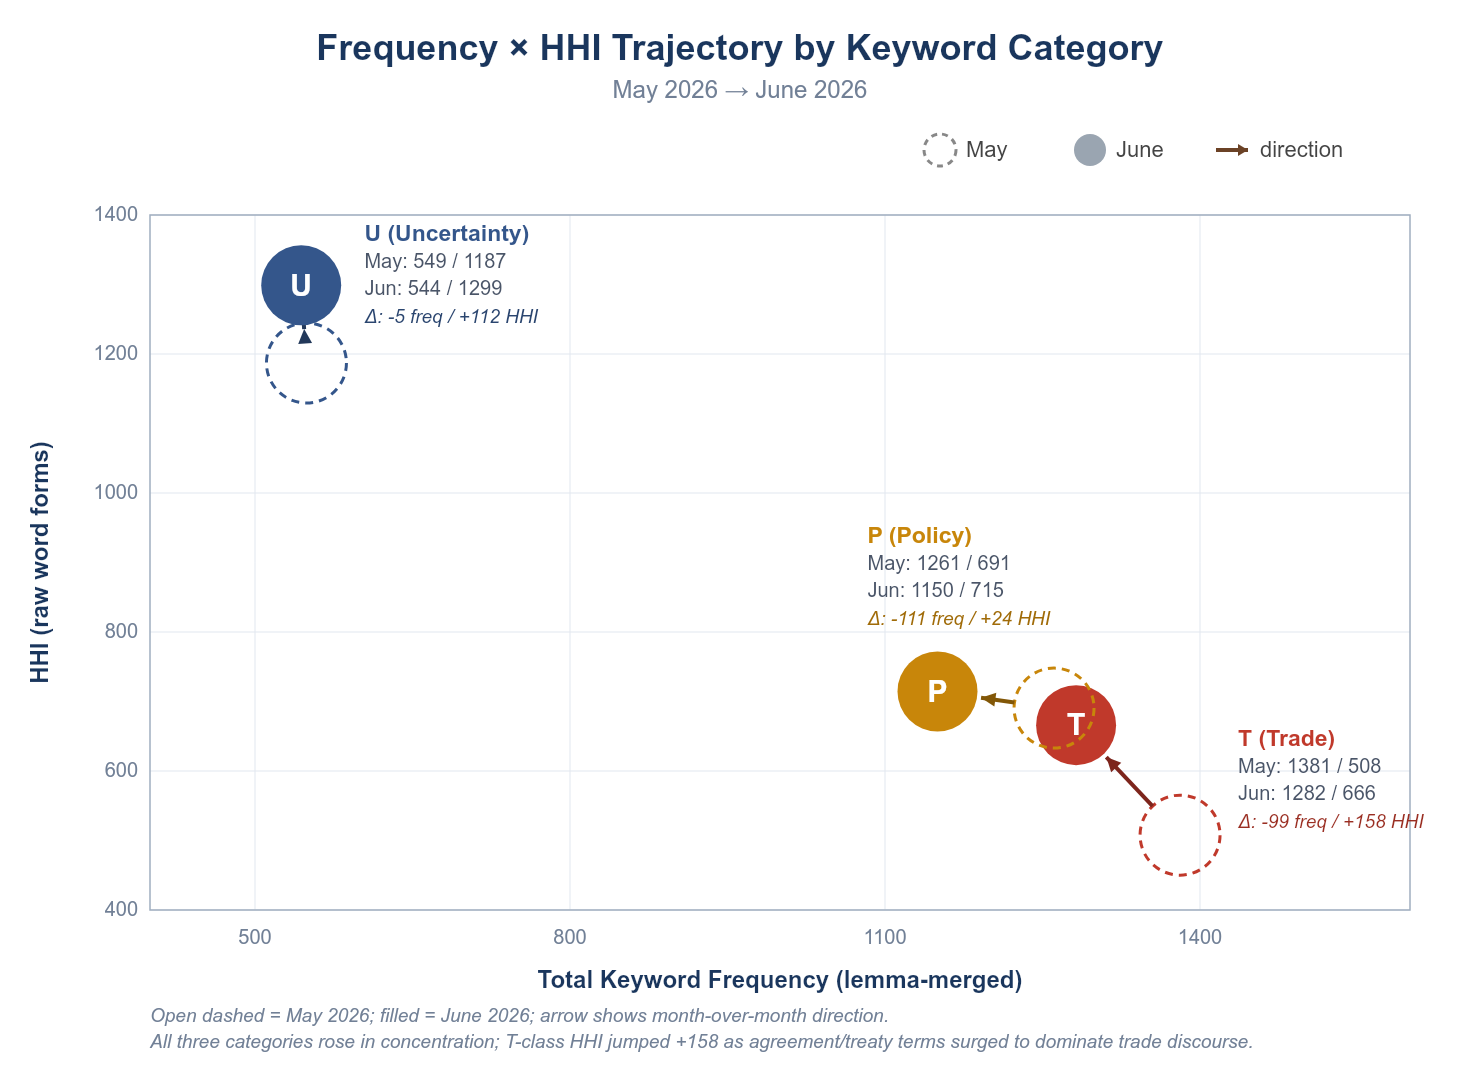
Figure 3.1 Keyword frequency × topic concentration (HHI) trajectory: May → June 2026
The trajectory shows the concentration of all three categories moving up in unison from May. Trade (T), even as its volume eased slightly (1381 → 1282), saw concentration jump (+158), driven by the “agreement” family standing out on its own; uncertainty (U) held roughly flat in volume while its concentration probed higher again, reflecting a renewed clustering of “risk” language in June. Overall the pattern is one of “a slight dip in total discourse but sharper focus on agreements and risk.”
4. Country Divergence
The CA-TPU index composites four national sub-indices by trade weight (KZ Kazakhstan, UZ Uzbekistan, KG Kyrgyzstan, TJ Tajikistan). In June the four continued to diverge, but the driving structure loosened somewhat from May.
Table 4.1 Four-country sub-index trends
| Country | Jun | May | MoM | Contribution to composite (Jun) |
| Kazakhstan | 42.26 | 40.21 | +5.1% | about 16.4% |
| Uzbekistan | 343.52 | 472.18 | −27.2% | about 75.2% |
| Kyrgyzstan | 65.98 | 93.35 | −29.3% | about 2.8% |
| Tajikistan | 191.55 | 146.34 | +30.9% | about 5.6% |
Source: CA-TPU Index Project. CA-TPU is a trade-weighted composite of the four countries; weights are based on 2024 trade data, with Kazakhstan around 60% and Uzbekistan around one-third.
On a weighted basis, Uzbekistan alone contributed about 75.2% (≈110.9 points) of the June composite and remains the absolute main driver; Kazakhstan, despite the highest trade weight (around 60%), contributed only about 16.4% (≈24.2 points) owing to its low sub-index. Of the 40.13-point net decline from May, Uzbekistan alone accounted for about −41.5 points — the sole source of the pullback; Tajikistan rose against the trend (+30.9%), partly offsetting it, while Kazakhstan steadied at a low level and remained the lowest of the four.
It should be noted that the absolute level of Uzbekistan’s sub-index is systematically inflated by sparse base-period samples (see Section 6); its directional change (a clear pullback this month) can be read normally, but its absolute magnitude should not be over-interpreted.
Table 4.2 Four-country distribution of major keyword families (Jun, lemmatised)
| Cat. | Lemma family | Total | KZ | UZ | KG | TJ |
| T | соглашение (agreement/treaty) | 381 | 56 | 283 | 27 | 15 |
| T | торговля (trade) | 332 | 87 | 168 | 44 | 33 |
| P | решение (decisions) | 244 | 68 | 133 | 22 | 21 |
| U | риск (risk) | 347 | 134 | 90 | 76 | 47 |
| T | санкции (sanctions) | 162 | 16 | 86 | 56 | 4 |
| T | экспорт (exports) | 150 | 38 | 68 | 17 | 27 |
| P | политика (policy) | 184 | 63 | 74 | 34 | 13 |
| T | договор (contracts/treaties) | 107 | 58 | 27 | 15 | 7 |
Source: CA-TPU Index Project; frequencies from four-country high-value news, after lemmatisation.
By country, this month’s surge in the “agreement” family was driven almost entirely by Uzbekistan — of the 381 mentions, Uzbekistan alone accounted for 283 (74.3%), continuing and reinforcing its “active negotiation” discourse profile. Kazakhstan, by contrast, continued to lead on “risk”: of the 347 mentions of the “risk” family, Kazakhstan accounted for 134 (38.6%). As the region’s largest economy, its sensitivity to tariff pass-through shows up in discourse as persistent risk framing.
Kyrgyzstan, though its news volume was only half that of Uzbekistan, carried a relatively high level of attention to “sanctions” (56 mentions, the highest of the four), consistent with its role in re-export trade and its sensitivity to secondary sanctions; Tajikistan’s small sample base keeps its absolute frequencies generally low, limiting their interpretive value, but its sub-index rising against the trend this month is worth noting.
5. Outlook and Variables to Watch
Drawing the month’s data together, the following variables are worth tracking through July–August.
First, whether the high-pressure stretch can extend into a fifth month or ends here. With MA3 ≥ 150 now for four consecutive months — an all-time record — if the raw index continues to fall in July and drags the MA3 below 150, the current high-pressure episode draws to a close; if it holds, the record is extended further, carrying a stronger cautionary signal.
Second, whether the renewed warming of “agreement/sanctions/risk” is a trend or a fluctuation. In June the discourse swung from “concrete trade instruments” back to “bargaining over agreements and risk framing”; if July continues in this direction, it suggests the negotiations are entering a more confrontational phase; if it turns back toward operational terms such as tariffs and contracts, it is more likely normal month-to-month oscillation.
Third, whether Uzbekistan’s sub-index continues to retreat. This month it fell from 472.18 to 343.52 but remains at a high level; a sustained pullback would confirm May’s extreme reading as a single-point pulse and ease the “narrow but deep” pattern of the current high-pressure episode.
Fourth, whether Kazakhstan’s sub-index turns upward. The country has been at a low level for several consecutive months, and this month’s 42.26 is still the lowest of the four, diverging from its highest trade weight; a clear upturn in the Kazakhstan index would be a broader-based, higher-level risk signal.
6. Accompanying Materials
This report is accompanied by two items. The first is the data-transparency package, containing the month-level aggregated data underlying every chart in this report (10 CSV files) and a bilingual data-usage guide, to allow independent verification by third parties. The second is a plain-language brief for businesses and trade practitioners, interpreting the month’s key points and their implications for business practice in non-technical language. The key figures in both are fully consistent with this report.
On Uzbekistan’s absolute sub-index level: since January 2026 the country’s readings have run persistently high, related to its sample characteristics within the 2015–2019 base period; this is a methodological limitation the project team has identified. For this sub-index, attention should focus on direction and relative trend rather than absolute level. This caveat is kept consistent across the three language editions and the data package.
About the CA-TPU Index
The CA-TPU (Central Asia Trade Policy Uncertainty Index) was developed by the team of Professor Zhang Lijie at the School of Economics and Management, Xinjiang University, built on the economic-policy-uncertainty approach of Baker, Bloom and Davis (2016), covering the main Russian-language media of Kazakhstan, Uzbekistan, Kyrgyzstan and Tajikistan. The index measures the intensity with which these countries’ mainstream media simultaneously discuss trade, policy and uncertainty; the base period is 2015–2019, normalised to a base-period mean of 100, and it is released monthly. Full methodology, historical data and trilingual reports are available at catpu.caiees.cn.
This report is a non-profit academic output, independently funded, and does not constitute investment advice or a basis for business decisions. Attribution: CA-TPU Index Project.