
Key Points
In August 2026 the CA-TPU index rose to 101.65, up 6.8% month on month. The three-month moving average (MA3) fell to 114.71, down 20.0% on the month and only 2.9% above August 2025. In July the MA3 was still 27.0% above its year-earlier level; within one month that gap closed to near zero. The discourse pressure generated by the tariff war has returned to last year’s level.
The “domestic legislation and tariff digestion” storyline that formed in July ended in August. The four lemma families that rose against the trend in July all fell back: law −46.7%, tax −73.2%, tariffs −58.1%, imports −64.6%, each below its June level. Agreement (+48.0%), treaty (+56.0%) and political (+156.0%) rose. The August rebound rests on a narrow base: Kazakhstan’s sub-index, carrying around 60% of the trade weight, fell 27.5% to a recent low, and Uzbekistan alone drove the rise.
1. Index Overview
In August 2026 the raw CA-TPU index stood at 101.65, up 6.49 points (6.8%) from July’s 95.16 and down 12.05 points (10.6%) from August 2025’s 113.70, the second consecutive year-on-year decline. The three-month moving average (MA3) was 114.71, down 28.61 points (20.0%) from July’s 143.32.
Table 1.1 CA-TPU monthly index comparison
| Indicator | This month (Aug) | Last month (Jul) | MoM change | Year ago | YoY change |
| CA-TPU raw index | 101.65 | 95.16 | +6.49 (+6.8%) | 113.70 | −12.05 (−10.6%) |
| MA3 (moving average) | 114.71 | 143.32 | −28.61 (−20.0%) | 111.48 | +3.23 (+2.9%) |
Source: CA-TPU Index Project, based on the monthly release at catpu.caiees.cn.
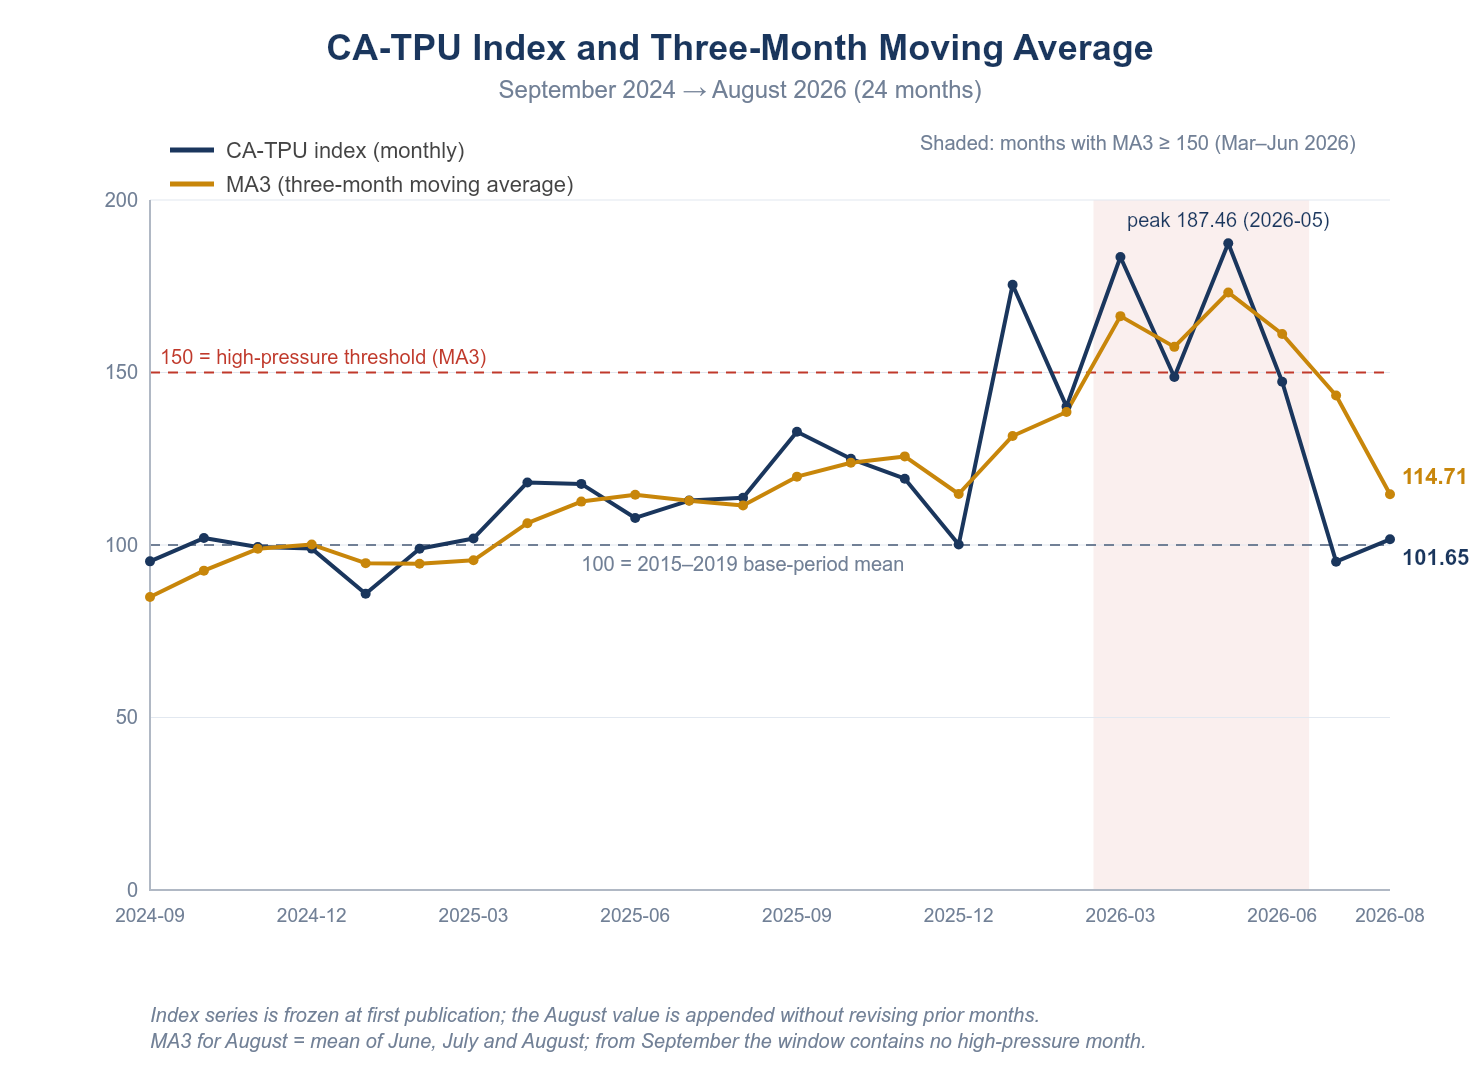
Figure 1.1 CA-TPU index and three-month moving average, September 2024 – August 2026
The monthly index and the moving average moved in opposite directions: the raw index rose 6.8% while the MA3 fell 20.0%. August’s MA3 averages June (147.33), July (95.16) and August (101.65); June’s high reading lifted the July and August averages and leaves the window in September. The monthly reading measures the discourse intensity of the current month; the MA3 measures the accumulated level over three months. This month the former edged up and the latter thinned sharply. From September the MA3 window will contain no high-pressure month (the shaded band in Figure 1.1).
The turning-point signal is in the year-on-year comparison. At +2.9%, the MA3 is level with August 2025; in July it was +27.0%. After two months of decline the accumulated pressure is back in the range that prevailed before the tariff war. The raw index, at −10.6% year on year, is already below its level of a year earlier.
2. Historical Context
Among the 212 months since 2009, the raw index of 101.65 ranks 99th, near the historical median; the MA3 of 114.71 ranks 58th, in the middle of the distribution. Both ranks fell markedly from July, and August occupies an ordinary position in the historical record. The all-time MA3 top six is unchanged from the previous two editions; 2026 holds three of the six places.
Table 2.1 All-time MA3 top six
| Rank | Month | Raw index | MA3 | Context |
| 1 | 2020-06 | 169.02 | 174.09 | COVID-19 pandemic |
| 2 | 2026-05 | 187.46 | 173.21 | Current episode (tariff war) |
| 3 | 2026-03 | 183.48 | 166.34 | Current episode (tariff war) |
| 4 | 2012-09 | 249.81 | 161.40 | Single-month spike |
| 5 | 2026-06 | 147.33 | 161.16 | Current episode (tariff war) |
| 6 | 2020-05 | 149.90 | 158.32 | COVID-19 pandemic |
Source: CA-TPU Index Project.
Taking MA3 ≥ 150 as the threshold, three high-pressure episodes have occurred since 2009: September–October 2012 (2 months), May–July 2020 (3 months) and March–June 2026 (4 months, the longest on record). The current episode ended in July. September’s MA3 will average July, August and September; to return to 150 it would need a September reading of at least 253.2, above the highest monthly value ever recorded (249.81 in September 2012). A return to the high-pressure zone in September is ruled out arithmetically.
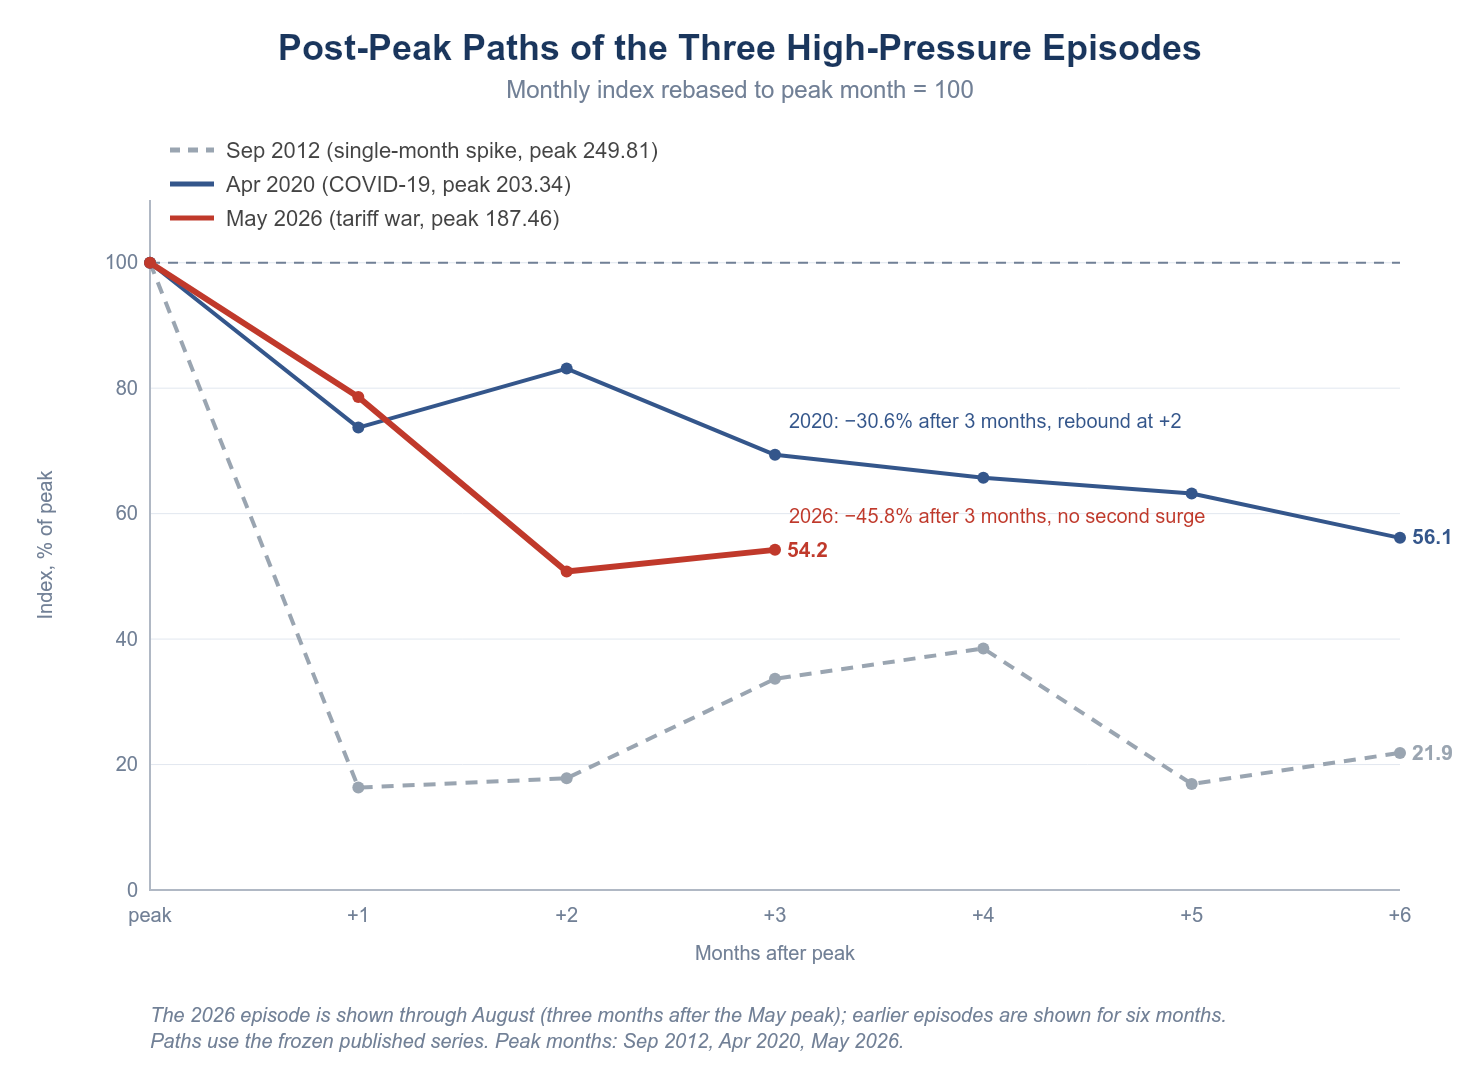
Figure 2.1 Post-peak paths of the three high-pressure episodes (peak month = 100)
The post-peak path shows a rapid decline. After the May peak (187.46) the index fell 21.4% in June and 35.4% in July, then rose 6.8% in August, a cumulative drawdown of 45.8% over three months with no second surge. After the April 2020 peak the three-month drawdown was about 30.6%, with a rebound to 83.1% of the peak in the second month. The September 2012 peak was a single-month spike that fell 83.7% the following month, a different shape altogether. Figure 2.1 rescales the three paths to peak month = 100: the current episode’s depth lies between the other two, and its decline is faster than 2020’s.
3. Shift in Discourse Structure
The project team counted, after lemmatisation of case forms, the keywords in all August high-value news (articles that hit the trade, policy and uncertainty categories simultaneously) and compared them with July. The central finding: the discourse storyline that formed in July broke off within a month.
Totals first: policy-category frequency fell from 1,128 to 879 (−22.1%), trade from 832 to 717 (−13.8%) and uncertainty from 416 to 379 (−8.9%). All three contracted together, with policy falling most. In July the pattern was the opposite: policy largely held while trade retreated sharply.
Structure next. The four lemma families that rose against the trend in July, read at the time as “domestic legislation and tariff digestion”, all fell back sharply: law (закон) from 210 to 112 (−46.7%), tax (налог) from 41 to 11 (−73.2%), tariffs (тариф) from 74 to 31 (−58.1%) and imports (импорт) from 96 to 34 (−64.6%), each below its June level. Another group warmed up: treaty (договор) +56.0%, agreement (соглашение) +48.0%, political (политический) +156.0% and tension (напряженность) +19.4%.
Table 3.1 Month-on-month change in lemma-family frequency (Aug vs Jul, after lemmatisation)
| Category | Lemma family | Aug | Jul | MoM |
| P | политический (political) | 64 | 25 | +156.0% |
| T | договор (contract/treaty) | 117 | 75 | +56.0% |
| T | соглашение (agreement) | 145 | 98 | +48.0% |
| P | стратегия (strategy) | 55 | 49 | +12.2% |
| T | экспорт (exports) | 79 | 139 | −43.2% |
| P | закон (law) | 112 | 210 | −46.7% |
| T | тариф (tariffs) | 31 | 74 | −58.1% |
| T | импорт (imports) | 34 | 96 | −64.6% |
| P | налог (tax) | 11 | 41 | −73.2% |
Source: CA-TPU Index Project; frequencies from four-country high-value news, after lemmatisation. The July column equals the values published in the previous edition.
The July report listed “whether the rise in the law, tax and tariff families continues” as a variable to watch. August’s answer is no: the group did not continue, and it fell below June’s level. A frequency that spikes and retreats within one month matches a bout of concentrated processing; it does not match a sustained process of institutional adjustment.
Topic concentration (HHI) also reversed. The trade category rose from 477.0 to 568.2 (+91.2), partly repairing July’s sharp dispersion (−181.3): the return of the agreement and treaty families pulled trade discourse back toward a few themes. The policy category fell from 660.9 to 633.3 (−27.6), dispersing further after the law family receded. The uncertainty category eased from 1,323.2 to 1,290.5 (−32.7) and remains the most concentrated of the three, with risk as the dominant term.
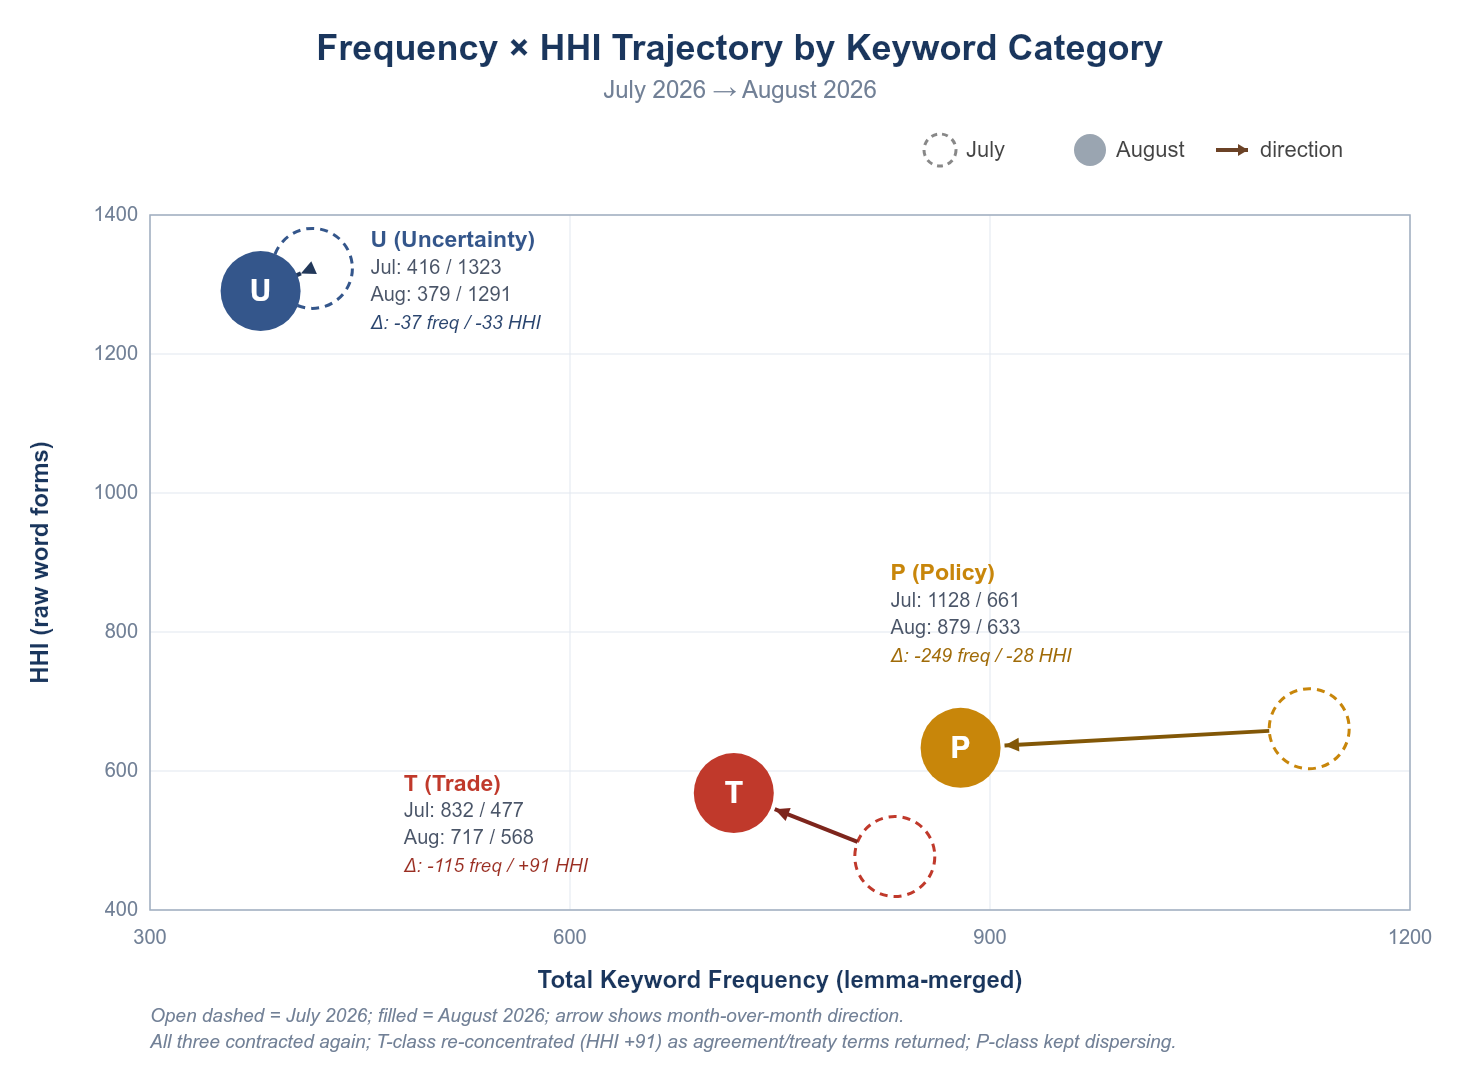
Figure 3.1 Frequency × topic concentration (HHI) trajectory, July → August 2026
The trajectory shows all three categories moving further left: total discourse volume shrank again. Trade (T) lost 115 in frequency while its concentration rose by 91, turning from July’s lower-left direction to upper-left. Policy (P) moved furthest, losing 249 in frequency with concentration still falling; it is the main source of this month’s contraction. Uncertainty (U) moved least and stays in the high-concentration upper-left corner: the volume of risk discourse is falling while its focus is unchanged.
4. Country Divergence
The CA-TPU index composites four national sub-indices by trade weight (KZ Kazakhstan, UZ Uzbekistan, KG Kyrgyzstan, TJ Tajikistan). The defining feature of August is that the composite rose while the largest-weight country cooled.
Table 4.1 Country sub-indices
| Country | Aug | Jul | MoM | Contribution to composite (Aug) |
| Kazakhstan | 33.01 | 45.51 | −27.5% | about 18.6% |
| Uzbekistan | 220.69 | 180.52 | +22.3% | about 70.1% |
| Kyrgyzstan | 108.96 | 91.14 | +19.6% | about 6.7% |
| Tajikistan | 110.51 | 120.94 | −8.6% | about 4.6% |
Source: CA-TPU Index Project. CA-TPU is a trade-weighted composite of the four countries; weights follow the 2024 trade pattern, with Kazakhstan around 60% and Uzbekistan around one-third.
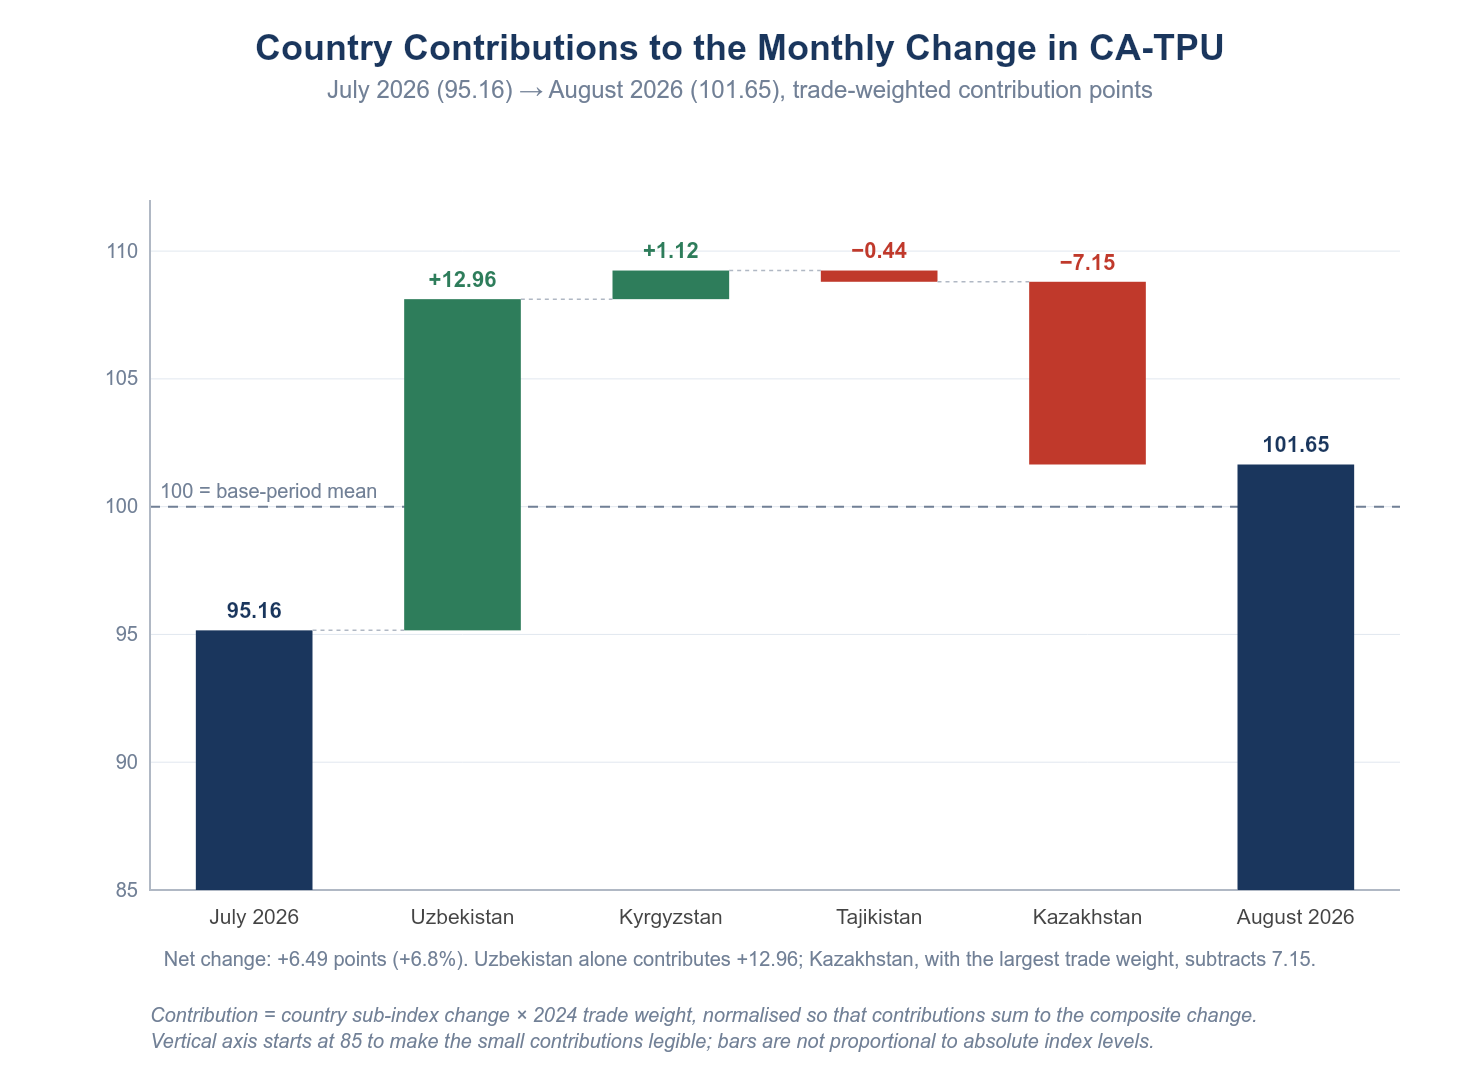
Figure 4.1 Country contributions to the monthly change in the composite index, July → August 2026
Weighted, the composite’s net gain of 6.49 points over July decomposes into +12.96 from Uzbekistan, +1.12 from Kyrgyzstan, −0.44 from Tajikistan and −7.15 from Kazakhstan (Figure 4.1). Without Uzbekistan’s rebound the composite would have fallen again. Uzbekistan’s contribution share rose from 61.2% in July to 70.1%, and the driving structure re-concentrated.
Kazakhstan’s sub-index fell to 33.01, its lowest recent reading. The country’s news volume remained the largest of the four (2,388 OR hits); the decline came from hit density: the AND/OR ratio fell from 0.0473 in July to 0.0343, so a smaller share of articles touched trade, policy and uncertainty at once. With around 60% of the trade weight, this cooling was the single strongest drag on the composite in August. Holding the other three sub-indices fixed, a Kazakhstan reading below 30.1 would return the composite to below 100.
Uzbekistan’s sub-index rose to 220.69; the caveat on its absolute level is set out in Chapter 6. Tajikistan recorded only 9 AND hits in August; the movement in its sub-index carries no statistical meaning and this report does not interpret it separately.
Table 4.2 Four-country distribution of the main lemma families (Aug, after lemmatisation)
| Cat. | Lemma family | Total | KZ | UZ | KG | TJ |
| T | торговля (trade) | 243 | 98 | 83 | 51 | 11 |
| U | риск (risk) | 244 | 114 | 47 | 75 | 8 |
| P | решение (decisions) | 185 | 67 | 56 | 58 | 4 |
| T | соглашение (agreement) | 145 | 68 | 26 | 47 | 4 |
| T | договор (contract/treaty) | 117 | 36 | 16 | 61 | 4 |
| P | закон (law) | 112 | 24 | 66 | 20 | 2 |
| P | политика (policy) | 107 | 51 | 37 | 16 | 3 |
| T | экспорт (exports) | 79 | 32 | 29 | 14 | 4 |
Source: CA-TPU Index Project; frequencies from four-country high-value news, after lemmatisation.
By country, the centre of the agenda shifted. Kazakhstan led the “law” discourse in July (160 of 210 mentions, 76.2%); in August its count shrank to 24, while Uzbekistan’s rose from 15 to 66, or 58.9% of the regional total of 112. The geographic centre of legislative discourse moved from Kazakhstan to Uzbekistan within one month.
Distribution of the two recovering families: of 145 “agreement” mentions, Kazakhstan accounts for 68 (46.9%), Kyrgyzstan 47 (32.4%) and Uzbekistan 26 (17.9%); of 117 “treaty” mentions, Kyrgyzstan accounts for 61 (52.1%). August’s recovery in agreement discourse came from Kazakhstan and Kyrgyzstan, while Uzbekistan, long the dominant voice on this topic, stayed low (74.3% in June, 17.3% in July, 17.9% in August). Risk discourse is still carried by Kazakhstan (114, 46.7%) and Kyrgyzstan (75, 30.7%).
5. Outlook and Variables to Watch
Four variables merit tracking in September and October.
First, whether pressure settles in the normal range. The MA3’s year-on-year gap has narrowed to +2.9%. If the September MA3 stays within 100–120, the current discourse shock is over; if it rises above 130, a new source of shock has to be assessed. A return above 150 in September is arithmetically impossible (see Chapter 2).
Second, whether Kazakhstan’s sub-index stops falling. It has dropped to 33.01 and its hit density has declined for consecutive months. With around 60% of the trade weight, its direction decides the composite; holding the other three fixed, a reading below 30.1 pulls the composite back under 100.
Third, whether the recovery in agreement and treaty discourse continues. This month’s rise came with a repair of trade-category concentration. If it strengthens in September, a new round of framework negotiation in the region may be under way; if it retreats as the law family did in July, it is a normal month-to-month swing. Given July’s experience, a storyline that appears in a single month needs the following month’s data before it is treated as a trend.
Fourth, continued shrinkage of the sample. AND hits fell to 191, the lowest of 2026; the f_ratio fell to 3.84%, its fourth consecutive monthly decline. A smaller sample amplifies monthly swings in the sub-indices, Tajikistan’s most of all. If the trend continues, future reports will raise the threshold for interpreting small-country sub-indices.
6. Accompanying Materials
Two companion materials accompany this report: a data-transparency package (the month-level aggregates behind every figure and table, 10 CSV files, with a data guide in Chinese and English) and a plain-language brief for businesses and trade practitioners. The key figures in both match this report.
Figure set from this edition: an index chart (Figure 1.1), a post-peak path comparison (Figure 2.1) and a country contribution decomposition (Figure 4.1) are added; the keyword frequency × concentration trajectory (Figure 3.1) is retained. The index chart is a fixed figure from this edition onward; the other figures are chosen to fit each month’s narrative.
Data vintage: the CA-TPU index series (including the country sub-indices) is frozen at publication; past months are not revised when the corpus is updated. Corpus diagnostics such as keyword frequencies, topic concentration (HHI) and coverage are recomputed in full on the latest corpus snapshot each edition, so that all months within one edition are compared on the same basis. The July diagnostics shown in this edition equal the values published last month; no revision occurred.
Uzbekistan’s sub-index level: since January 2026 the country’s readings have been persistently high, a consequence of its sample characteristics in the 2015–2019 base period and a methodological limitation the project team has identified. For this sub-index the report interprets direction and relative trend, not absolute level. The same treatment applies in all three language versions and in the data package.
About the CA-TPU Index
The CA-TPU (Central Asia Trade Policy Uncertainty Index) was developed by Professor Zhang Lijie’s team at the School of Economics and Management, Xinjiang University, following the economic policy uncertainty method of Baker, Bloom and Davis (2016). It covers the main Russian-language media of Kazakhstan, Uzbekistan, Kyrgyzstan and Tajikistan and measures the intensity with which mainstream media in the four countries discuss trade, policy and uncertainty at the same time. The base period is 2015–2019, with the base-period mean normalised to 100; the index is released monthly. Full methodology, historical data and reports in three languages are available at catpu.caiees.cn.
This report is a non-profit academic product, independently funded, and does not constitute investment advice or a basis for business decisions. Author: CA-TPU Index Project.