
Quarterly overview
CA-TPU averaged 105.76 in the third quarter of 2026, down 34.37% from the second quarter and 11.73% from a year earlier. The quarterly average declined substantially, while the index rose within the quarter from 95.16 in July to 101.65 in August and 120.47 in September. The third quarter was characterized by a partial rebound after the decline from elevated first-half levels. The high concentration of joint-hit coverage in Uzbek sources diminished markedly. Sanctions and fuel issues persisted in Kyrgyz sources, while discussion of diplomatic cooperation and international trade increased again in September.
Article-by-article examination shows that keyword changes do not trace a single, one-directional policy development. 'Agreement' declined substantially from the second quarter, and its partial recovery in September was concentrated in a few Uzbek media reviews. Sanctions reporting continued from July's banking and corporate issues into September, receiving concentrated attention during the UN General Assembly. Fuel coverage declined in volume, while its focus shifted gradually from shortages to costs and inflation. Despite the fall in the quarterly indicator, bank transaction processing and fuel procurement remained specific issues receiving sustained attention.
1. Uzbek sources drove the quarterly decline; the within-quarter rebound remained below first-half levels
| Indicator | Value | Comparison |
|---|---|---|
| Second-quarter average | 161.16 | — |
| Third-quarter average | 105.76 | Quarter-on-quarter −34.37% |
| Third-quarter average a year earlier | 119.81 | Year-on-year −11.73% |
| July | 95.16 | Month-on-month −35.41% |
| August | 101.65 | Month-on-month +6.82% |
| September | 120.47 | Month-on-month +18.51% |
Quarterly averages are the arithmetic means of the three published monthly indices.
Of the approximately 55.40-point decline in the regional index from the second to the third quarter, the fall in Uzbekistan's sub-index contributed about 51.32 points, by far the largest component. Kazakhstan and Tajikistan contributed declines of approximately 1.98 and 2.82 points, respectively, while Kyrgyzstan's increase offset about 0.71 points. The quarterly decline therefore primarily reflects the marked fall from Uzbekistan's elevated level. It does not establish simultaneous improvements of equal magnitude in the policy environments of all four countries.
| Source country | Q2 sub-index | Q3 sub-index | Q2 records | Q3 records |
|---|---|---|---|---|
| Kazakhstan | 44.10 | 40.64 | 324 | 307 |
| Uzbekistan | 382.14 | 223.11 | 215 | 111 |
| Kyrgyzstan | 85.76 | 97.14 | 183 | 185 |
| Tajikistan | 169.73 | 103.70 | 111 | 33 |
Countries are classified by media-source location. Each sub-index is standardized against its own base period; record counts and sub-indices do not have a one-to-one relationship.
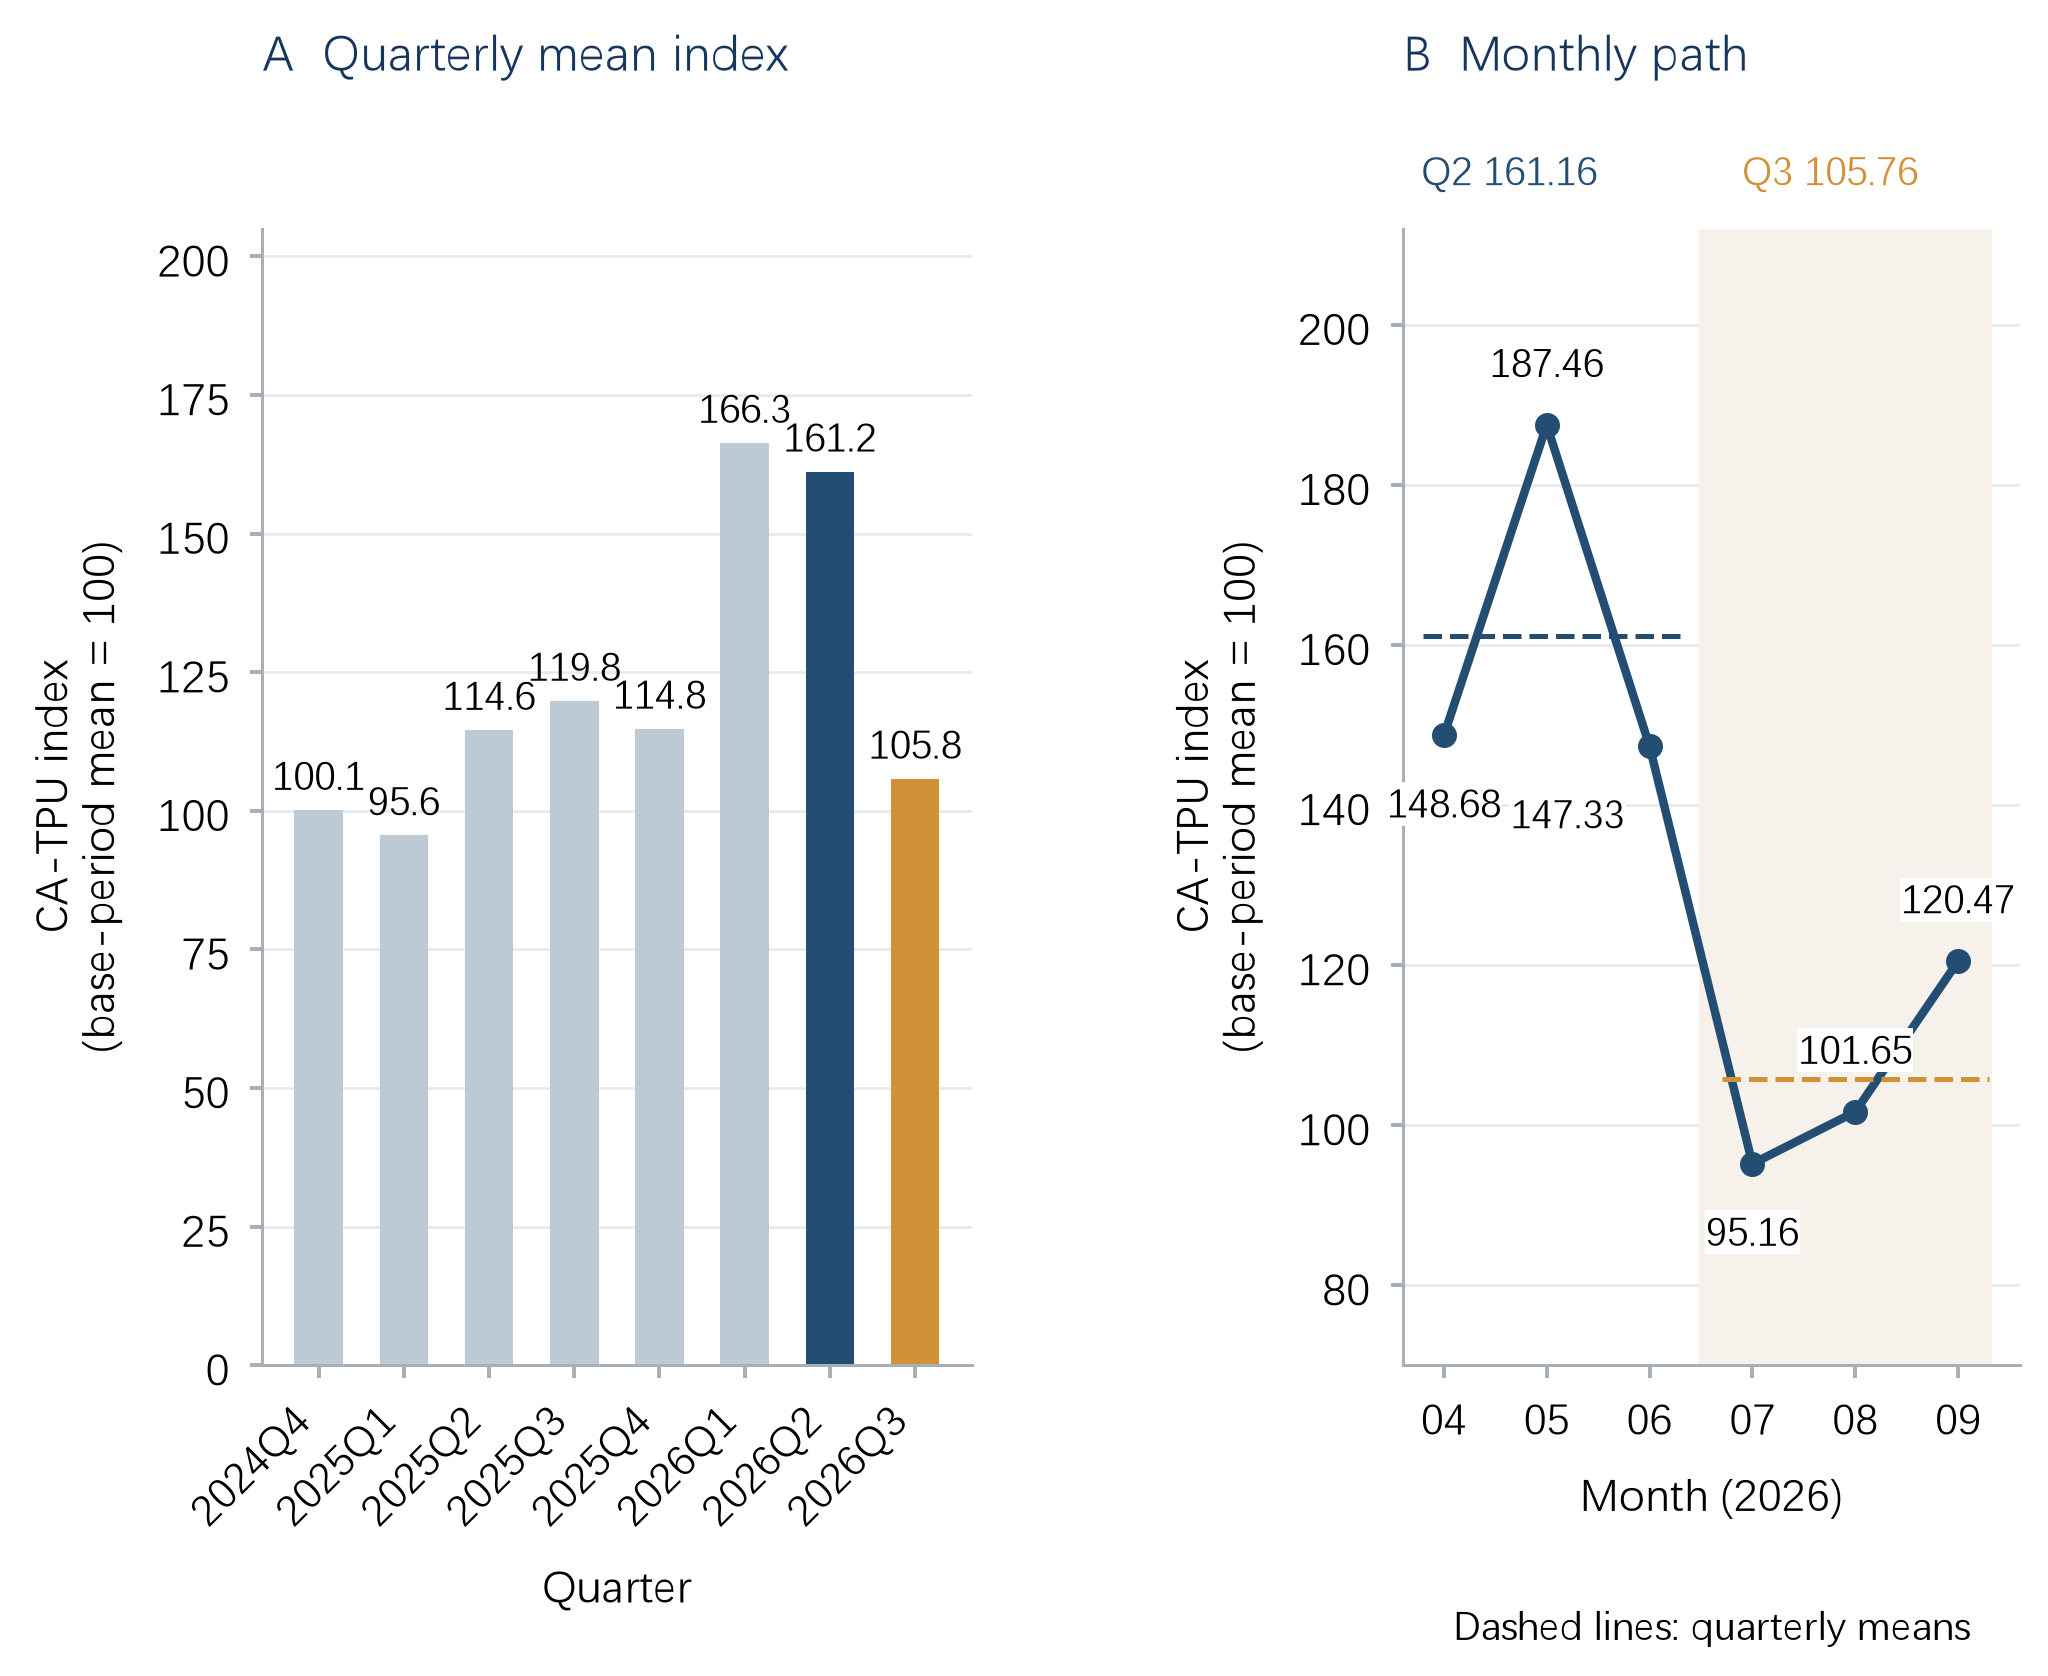
The left panel compares the latest eight complete quarters. The right panel shows monthly indices and quarterly averages for April–September 2026.
The quarter contained 32,364 news records, 3.00% more than the second quarter. Joint-hit records fell from 833 to 636, a decline of 23.65%. Records matching at least one keyword category fell from 16,369 to 15,645. The joint-hit proportion declined from 5.09% to 4.07%, a fall of 1.02 percentage points. More news records alongside a lower joint-hit proportion support the assessment of a decline in the quarterly media-based uncertainty indicator.
Coverage of the three keyword categories across all records also declined. Trade keywords fell from 19.57% to 18.10%, policy keywords from 41.39% to 37.92%, and uncertainty keywords from 9.17% to 7.74%. The decline in joint-hit records thus occurred within a broader change in the composition of reporting. At the same time, September's monthly index exceeded the quarterly average, giving the fourth quarter a different starting point from the average conditions of the third quarter.
2. Changing source composition: less joint-hit coverage in UzA and a contraction in Tajik coverage
The total number of joint-hit records fell by 197. Uzbek sources accounted for a decline of 104 and Tajik sources for 78, together representing 92.4% of the reduction. UzA fell from 185 in the second quarter to 87 in the third, while Kun.uz declined from 30 to 24. Uzbek records matching at least one keyword category decreased only from 2,182 to 2,048, but the joint-hit proportion fell from 9.85% to 5.42%. This difference indicates that the main change in Uzbek sources was a lower concentration of records containing keywords from multiple categories together.
| Outlet | Second quarter | Third quarter | Change |
|---|---|---|---|
| Kazinform | 200 | 202 | +2 |
| Forbes Kazakhstan | 124 | 105 | −19 |
| UzA | 185 | 87 | −98 |
| Kun.uz | 30 | 24 | −6 |
| Kaktus.media | 92 | 97 | +5 |
| 24.kg | 91 | 88 | −3 |
| Asia-Plus | 84 | 13 | −71 |
| Avesta | 27 | 20 | −7 |
The table counts news records included in the sample, not policy events.
The Tajik change also coincided with a marked contraction in news coverage. Total news records fell from 2,770 to 1,692. In the third-quarter sample, Asia-Plus had records only in July, with none in August or September. This outlet had contributed 84 joint-hit records in the second quarter, so its absence affects the composition of the Tajik sample. The fall in Tajikistan's sub-index should therefore not be treated as evidence of a general easing of regional risk. Among the four sub-indices, the decline in the Uzbek joint-hit proportion is relatively well supported; the Tajik decline needs to be interpreted alongside changes in source coverage.
The two Kazakh outlets together declined by only 17 records, with different movements within the total. Kazinform was broadly unchanged, while Forbes Kazakhstan fell by 19. In Kyrgyzstan, one source increased and the other decreased, with their combined total rising from 183 to 185. During the large decline in the regional average, Kyrgyz joint-hit records did not decrease, consistent with continuing reporting on fuel and sanctions compliance in that country.
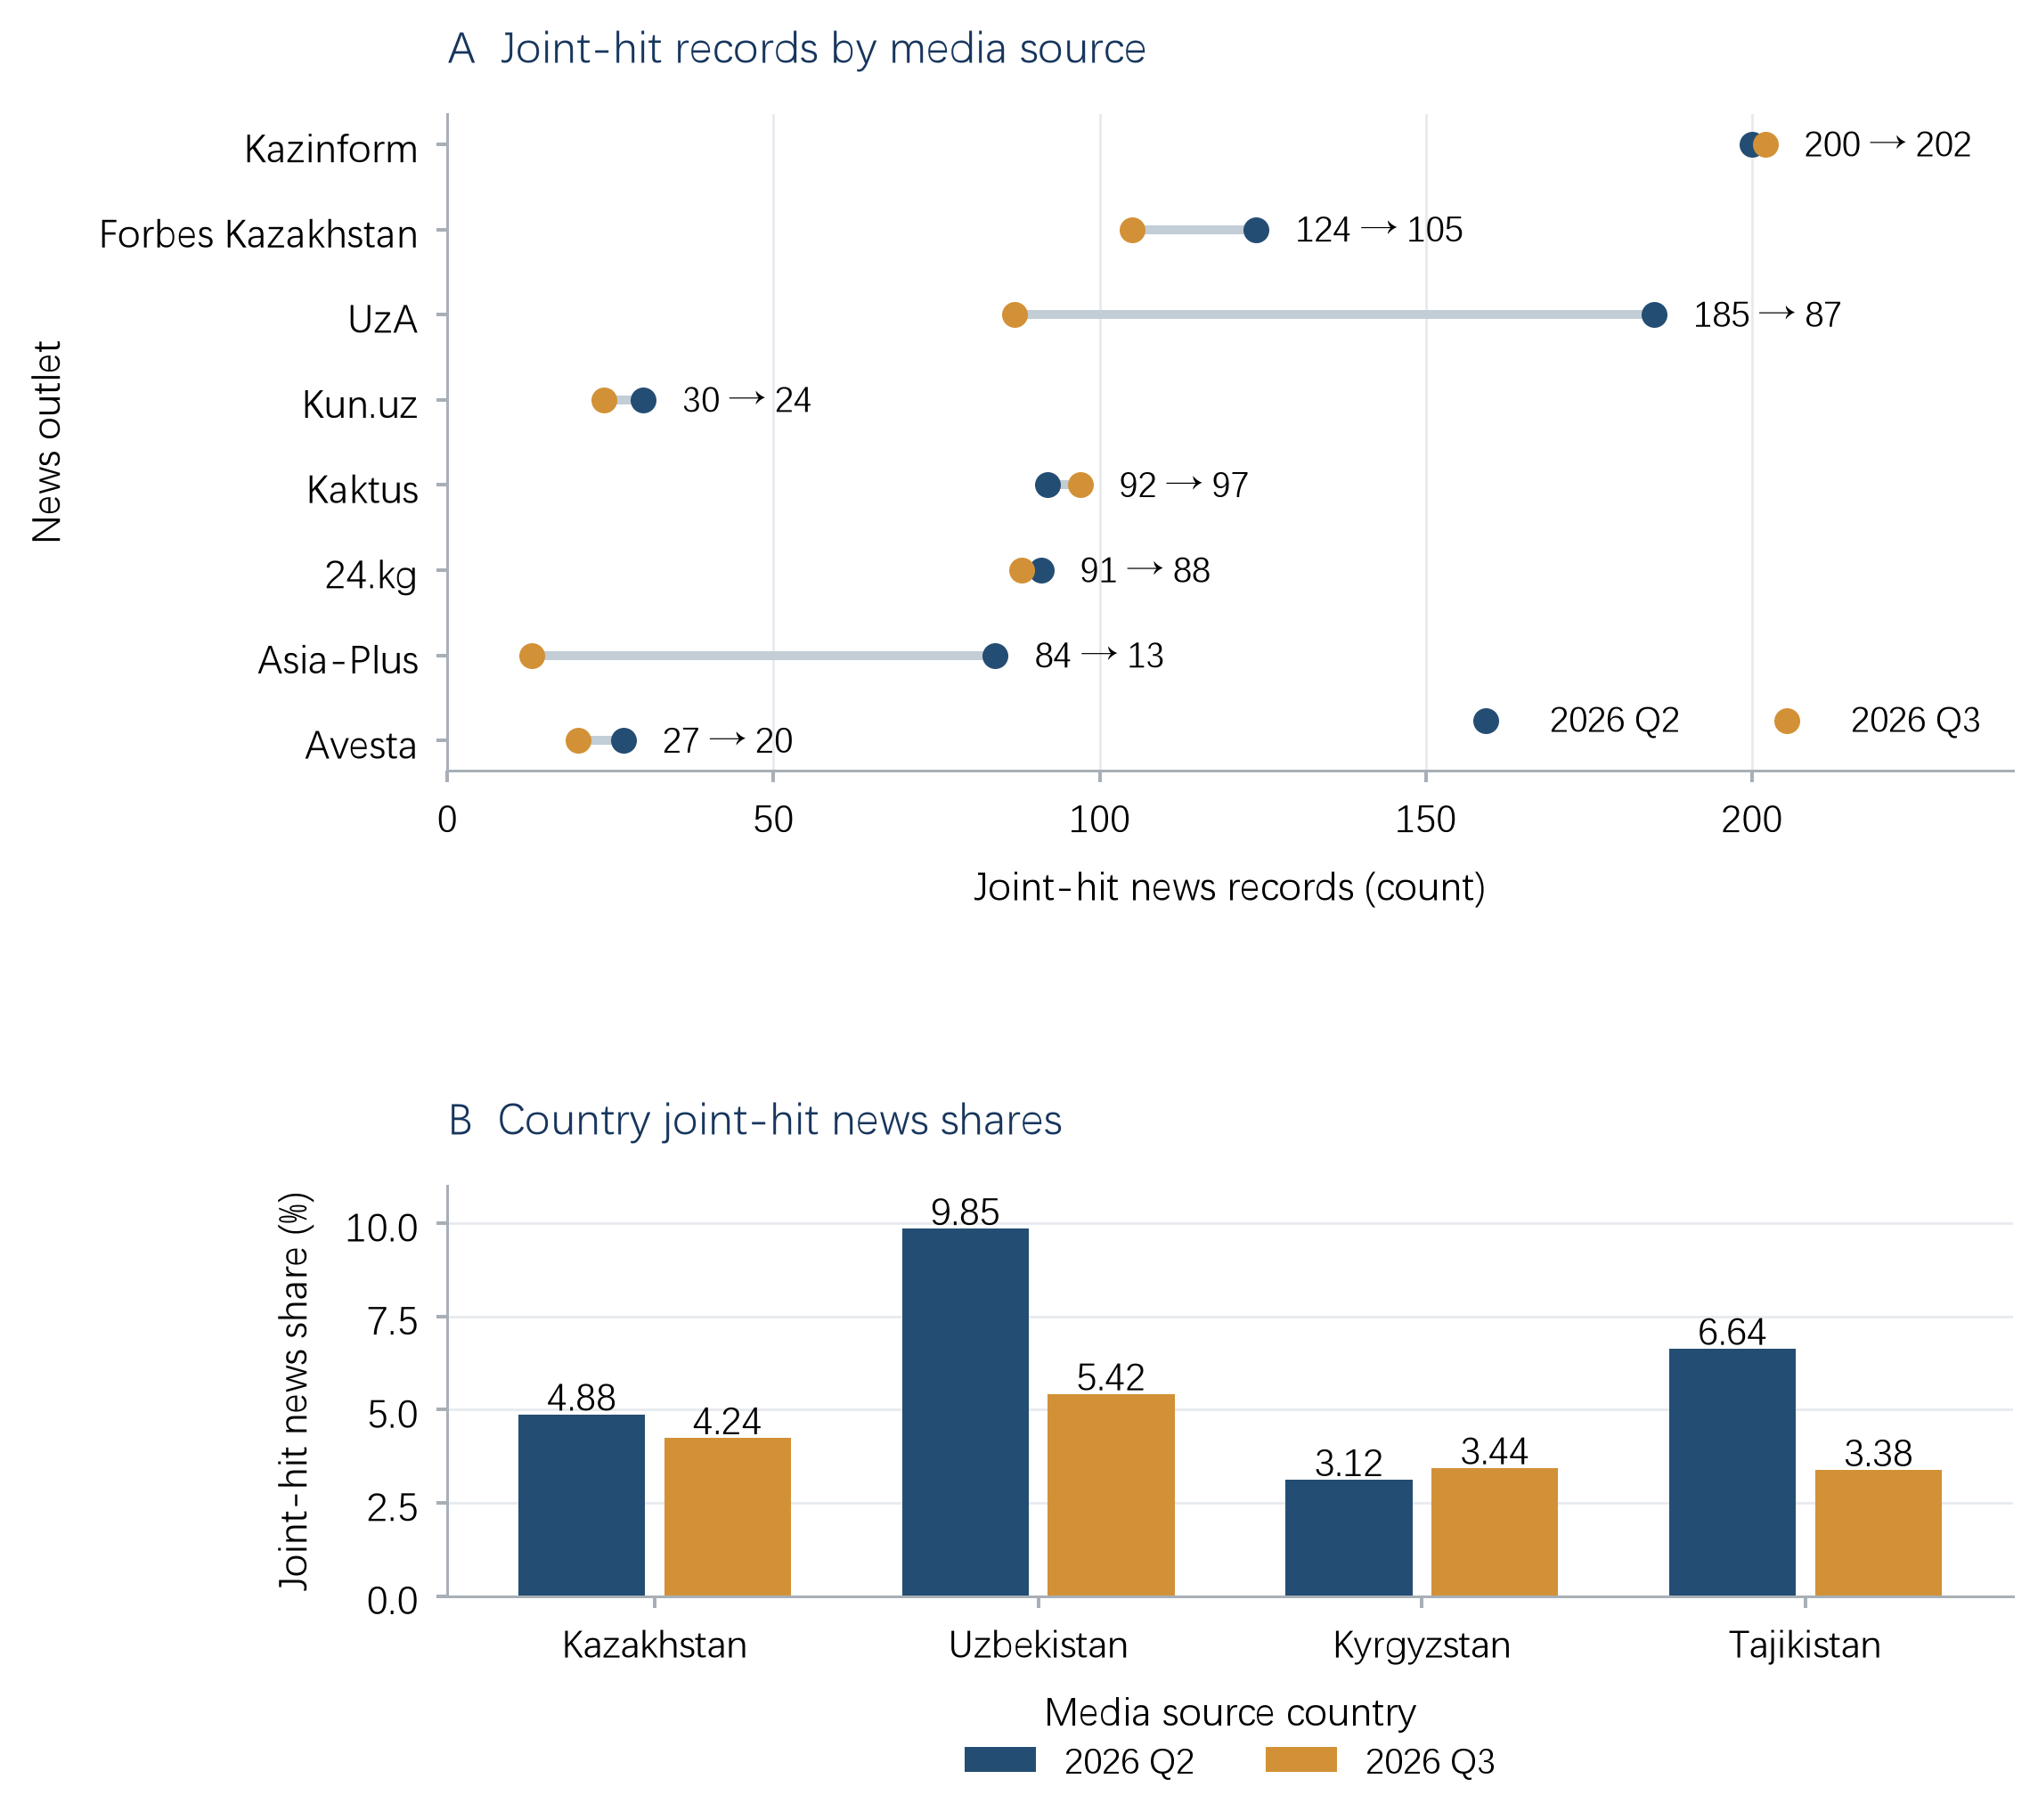
The left panel compares joint-hit record counts for eight outlets in the second and third quarters. The right panel compares country joint-hit proportions. Changes in source coverage and changes in the proportion within a given source are presented separately.
3. Keyword families: fewer agreements and sanctions, relatively stable discussion of laws
| Keyword family | Second quarter | Third quarter | Quarter-on-quarter |
|---|---|---|---|
| Trade | 1,208 | 986 | −18.38% |
| Agreement | 1,053 | 412 | −60.87% |
| Exports | 628 | 363 | −42.20% |
| Sanctions | 517 | 287 | −44.49% |
| Contract or treaty | 315 | 278 | −11.75% |
| Imports | 296 | 216 | −27.03% |
| Decision | 988 | 685 | −30.67% |
| Policy | 601 | 352 | −41.43% |
| Law | 435 | 419 | −3.68% |
| Risk | 1,150 | 804 | −30.09% |
| Crisis | 342 | 174 | −49.12% |
Frequencies count occurrences of keyword families within joint-hit records. Quarterly frequencies summarize text composition; interpreting specific policies requires examination of the original articles.
Discussion of 'agreement', particularly prominent in the second quarter, declined markedly in the third. Its decline was much larger than those of 'trade' and 'contract or treaty', consistent with the reduction in UzA joint-hit records. The 'law' family declined by only 3.68%, remaining relatively stable amid the overall reduction in word frequencies. Attention therefore did not subside uniformly across policy categories. Sources of discussion of laws also shifted, with greater concentration in Kazakh sources in July and Uzbek sources in August. The relatively stable quarterly total contained changes in which countries' issues were being reported.
September differed from the quarterly pattern. The 'trade' family reached 493 occurrences, about half of the third-quarter total. 'Sanctions' reached 152 occurrences, exceeding the combined July–August total of 135. 'Agreement' recovered to 168 occurrences, of which four UzA reviews contributed 46, highlighting the influence of a few long articles. The quarterly decline in attention coexisted with renewed concentrated reporting in September, indicating a change in the composition of issues at the end of the quarter.
The specific meanings of high-frequency words also changed with the subjects being reported. Articles with frequent occurrences of 'trade' included human trafficking in July, a historical account of the rise and fall of ancient cities in August, and an e-commerce platform ranking in September. These illustrate how word meanings and text composition affect the statistics. тариф was used for heating, electricity, transport, and customs tariffs. The observed increase in word frequency therefore reflects trade policy discussion together with social issues and long sectoral articles.
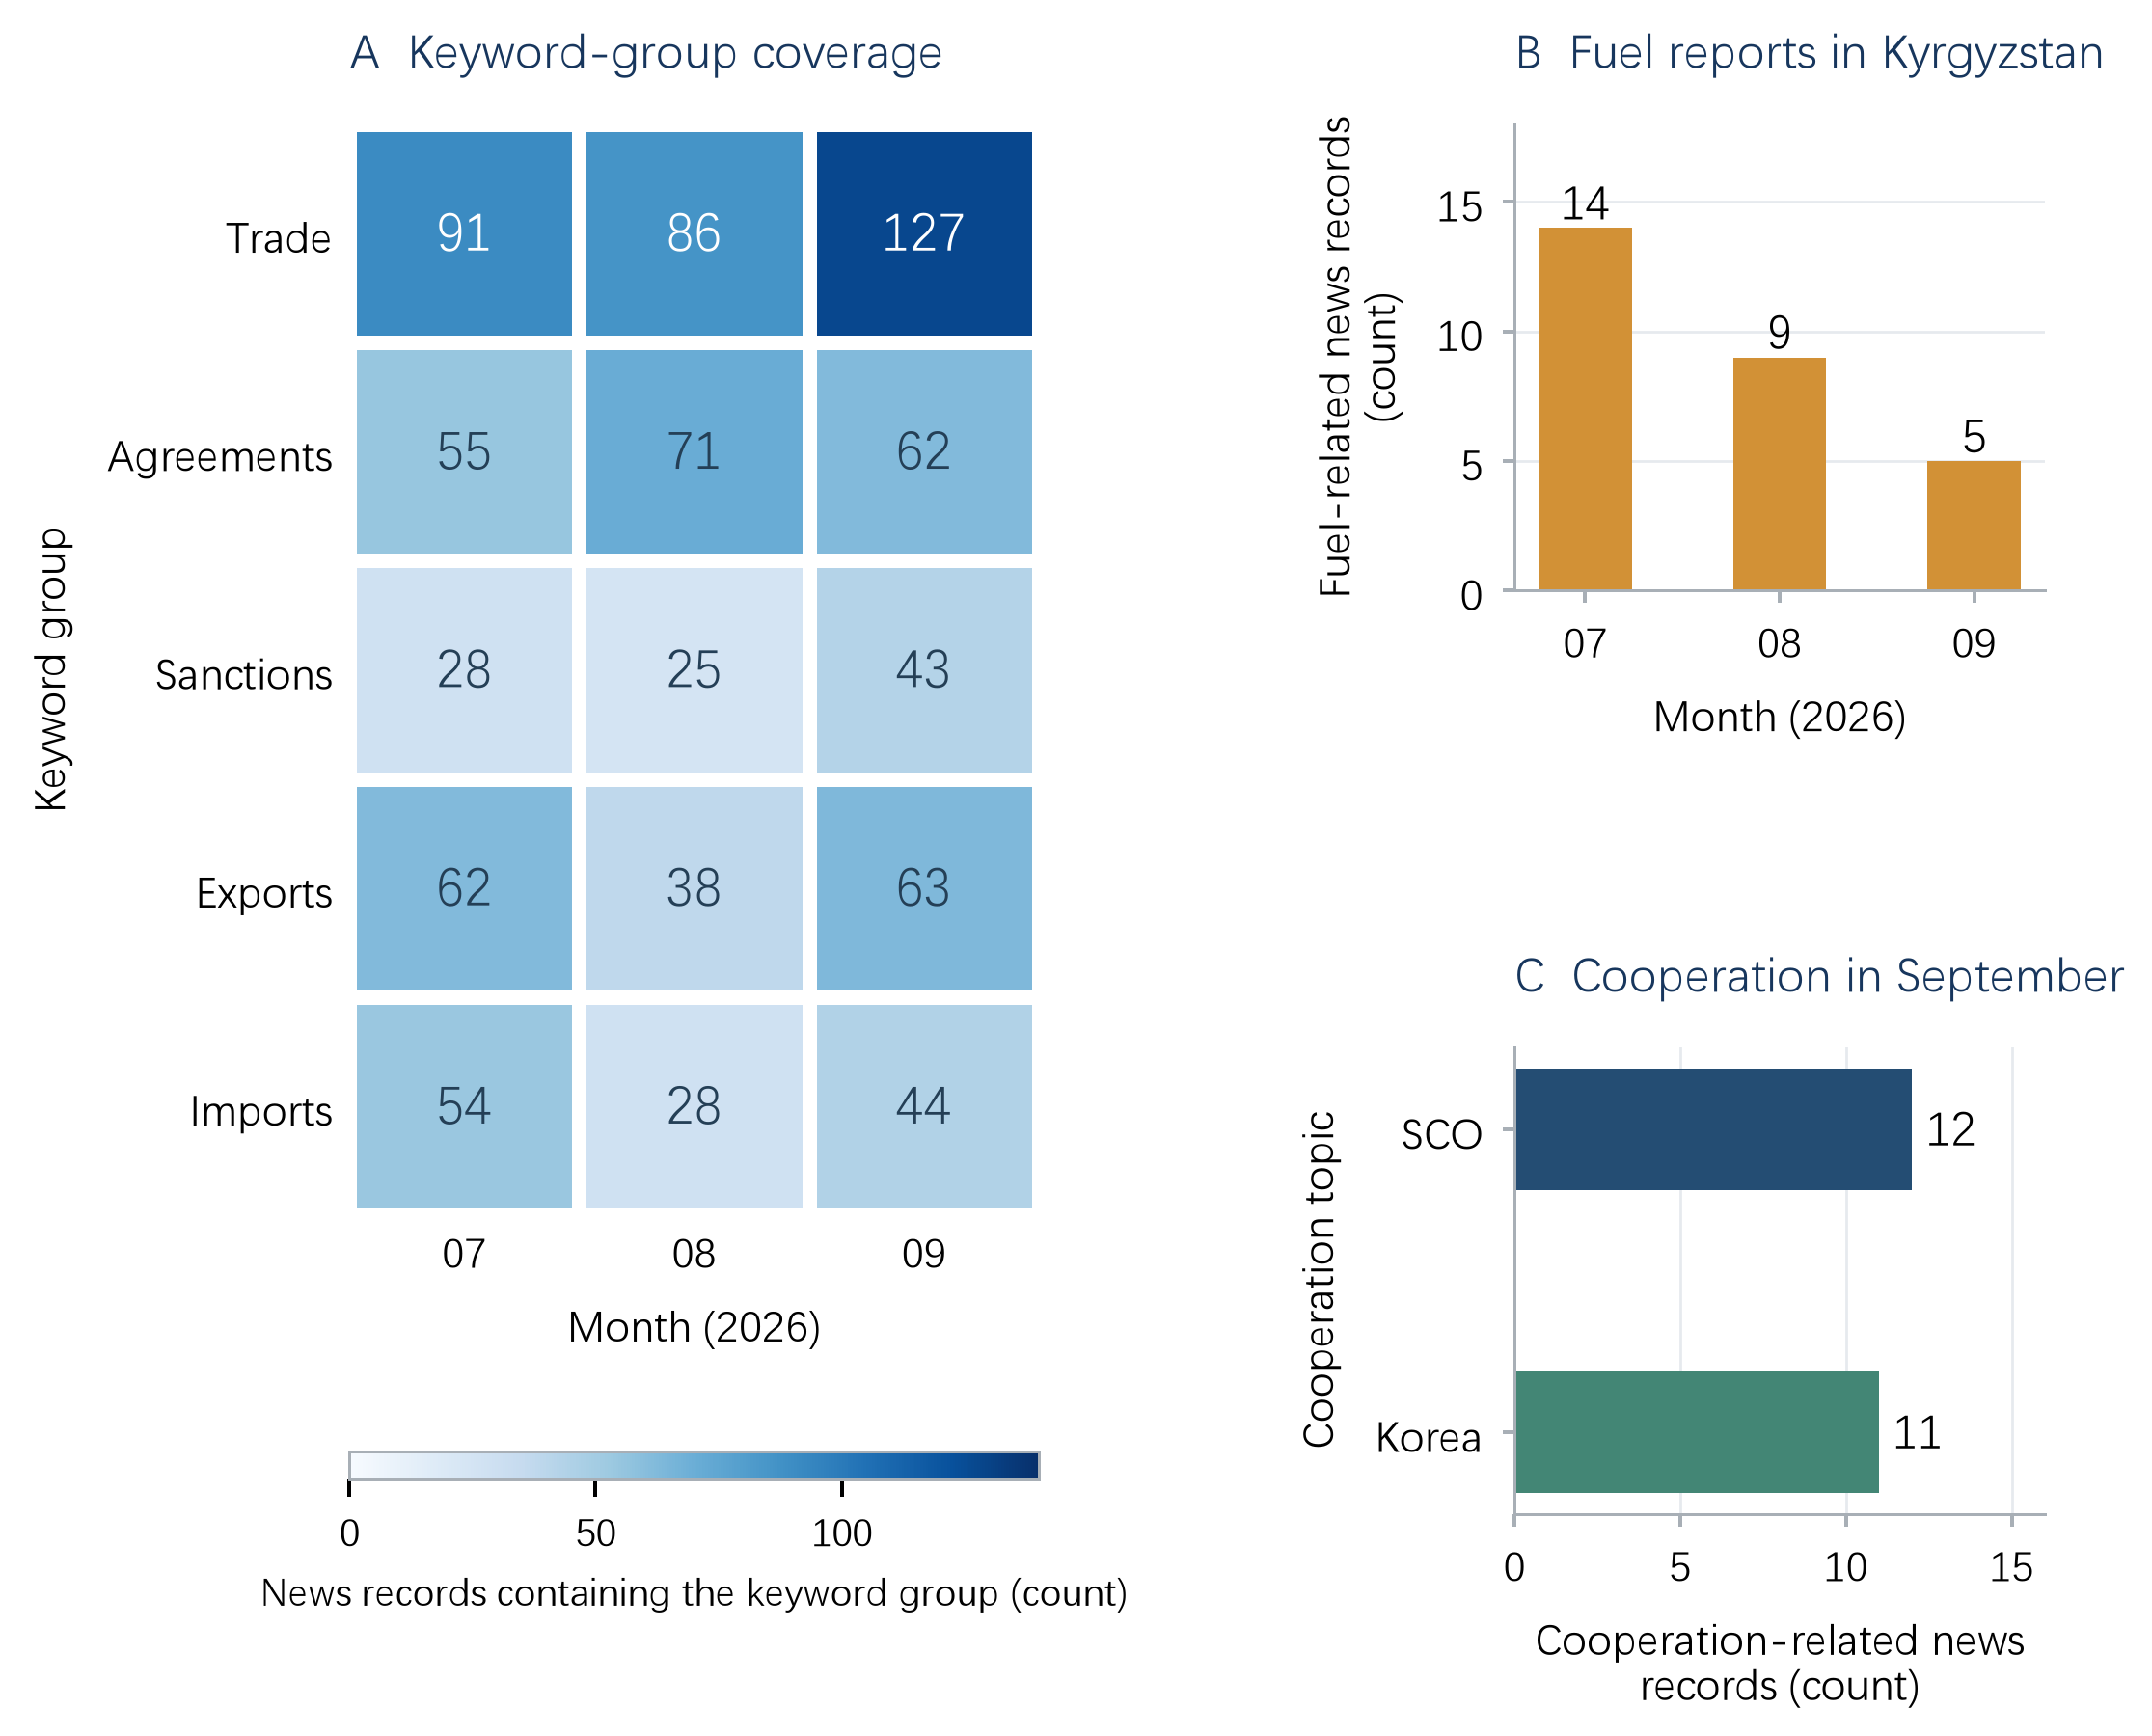
The left panel counts July–September records containing major keyword families. The right panel counts joint-hit records whose titles explicitly refer to fuel, the Shanghai Cooperation Organisation, or Central Asia–South Korea cooperation. Themes were identified by checking titles and article texts; the counts do not cover all related news.
4. Three developments: persistent supply pressure and sanctions discussion spanning implementation and diplomacy
Fuel provides a thread running through the quarter with a clear evolution in content. Joint-hit records explicitly referring to fuel in their titles numbered 14 in July, 9 in August, and 5 in September. July coverage centered on shortages at filling stations, refining capacity, and supplies from Russia. In August, attention shifted to alternative procurement, prices for new batches, and subsidy arrangements. September placed greater emphasis on the transmission of fuel price increases to inflation. Declining record counts describe changes in attention; assessing supply and prices still requires the underlying facts.
August reporting described the procurement problem more concretely. Low-cost existing stocks were being depleted, new import batches were more expensive, and retail price caps continued to constrain revenue. The amount and timing of proposed subsidies, including whether they would compensate retrospectively for batches already purchased, remained unclear. Operators needed to replenish stocks but could not readily determine whether new procurement costs would be recovered. This was a specific and direct intersection of trade and policy uncertainty in the quarter's news. September reporting examined transmission of costs to transport and food prices. Reports on disruptions to Russian supplies and the European Bank for Reconstruction and Development's outlook also continued to identify fuel as a source of price pressure. The speed of the supply recovery before winter and whether new procurement costs decline will determine how long this pressure lasts.
Sanctions coverage also continued across months. Kyrgyz sources contained 50, 31, and 77 occurrences of 'sanctions' in July, August, and September, respectively, across 9, 10, and 19 joint-hit records. Discussion of high-risk firms and bank screening was already present in July. August reporting described a proposal to initiate compulsory liquidation proceedings for 19 companies and disclosed that some banks had already terminated business relationships with certain firms. September continued with reporting on a common list, screening arrangements, and draft controls on dual-use items. By the end of the quarter, existing checks had extended toward coordination across banks and documentation of goods' end use, while the UN General Assembly address generated concentrated reporting.
Of the 77 September occurrences of 'sanctions' in Kyrgyz sources, 34 came from three records covering the same UN General Assembly address. This share shows how diplomatic events can amplify a keyword family's monthly increase. The parts with more direct relevance to economic activity concern which institutions perform which checks, the transactions covered by rules, and whether drafts become formal arrangements. The continuing development that can currently be identified is the extension of checks on high-risk firms into banking relationships and evidence of goods' end use.
A third thread is regional cooperation and summit reporting. From late August into early September, SCO-related coverage appeared in a concentration across several sources. In mid-September, Central Asia–South Korea cooperation generated discussion of industry, critical minerals, and technology projects. September contained 12 joint-hit records explicitly referring to the SCO in their titles and 11 referring to cooperation with South Korea or Seoul. The two groups together contained 8 occurrences of 'agreement', 4.8% of that keyword family's September frequency. Concentrated reporting on summit cooperation had only limited overlap with articles containing high frequencies of 'agreement'.
More reporting on regional cooperation can coincide with a rise in a news-based uncertainty indicator. Cooperation agendas often bring project opportunities, international developments, and supply chain risks into the same article, meeting the condition for joint occurrence of several keyword categories. Economically, this is closer to concentrated discussion of cooperation proposals and their implementation conditions than to confirmation of new trade barriers. The increase in long Uzbek media reviews in September illustrates this text structure.
5. Weekly patterns: declines and recoveries around two concentrations of coverage
The joint-hit proportion fluctuated between 2.80% and 5.12% during the quarter. It reached 5.09% in August 24–30 and 5.12% in August 31–September 6, two consecutive relatively high weeks. It then fell to 2.80% in September 7–13, recovered to 4.49% in September 14–20, and stood at 4.17% in September 21–27. This pattern of concentrated coverage, a decline, and a subsequent recovery describes the observations more accurately than a continuous quarterly deterioration or a steady disappearance of risk.
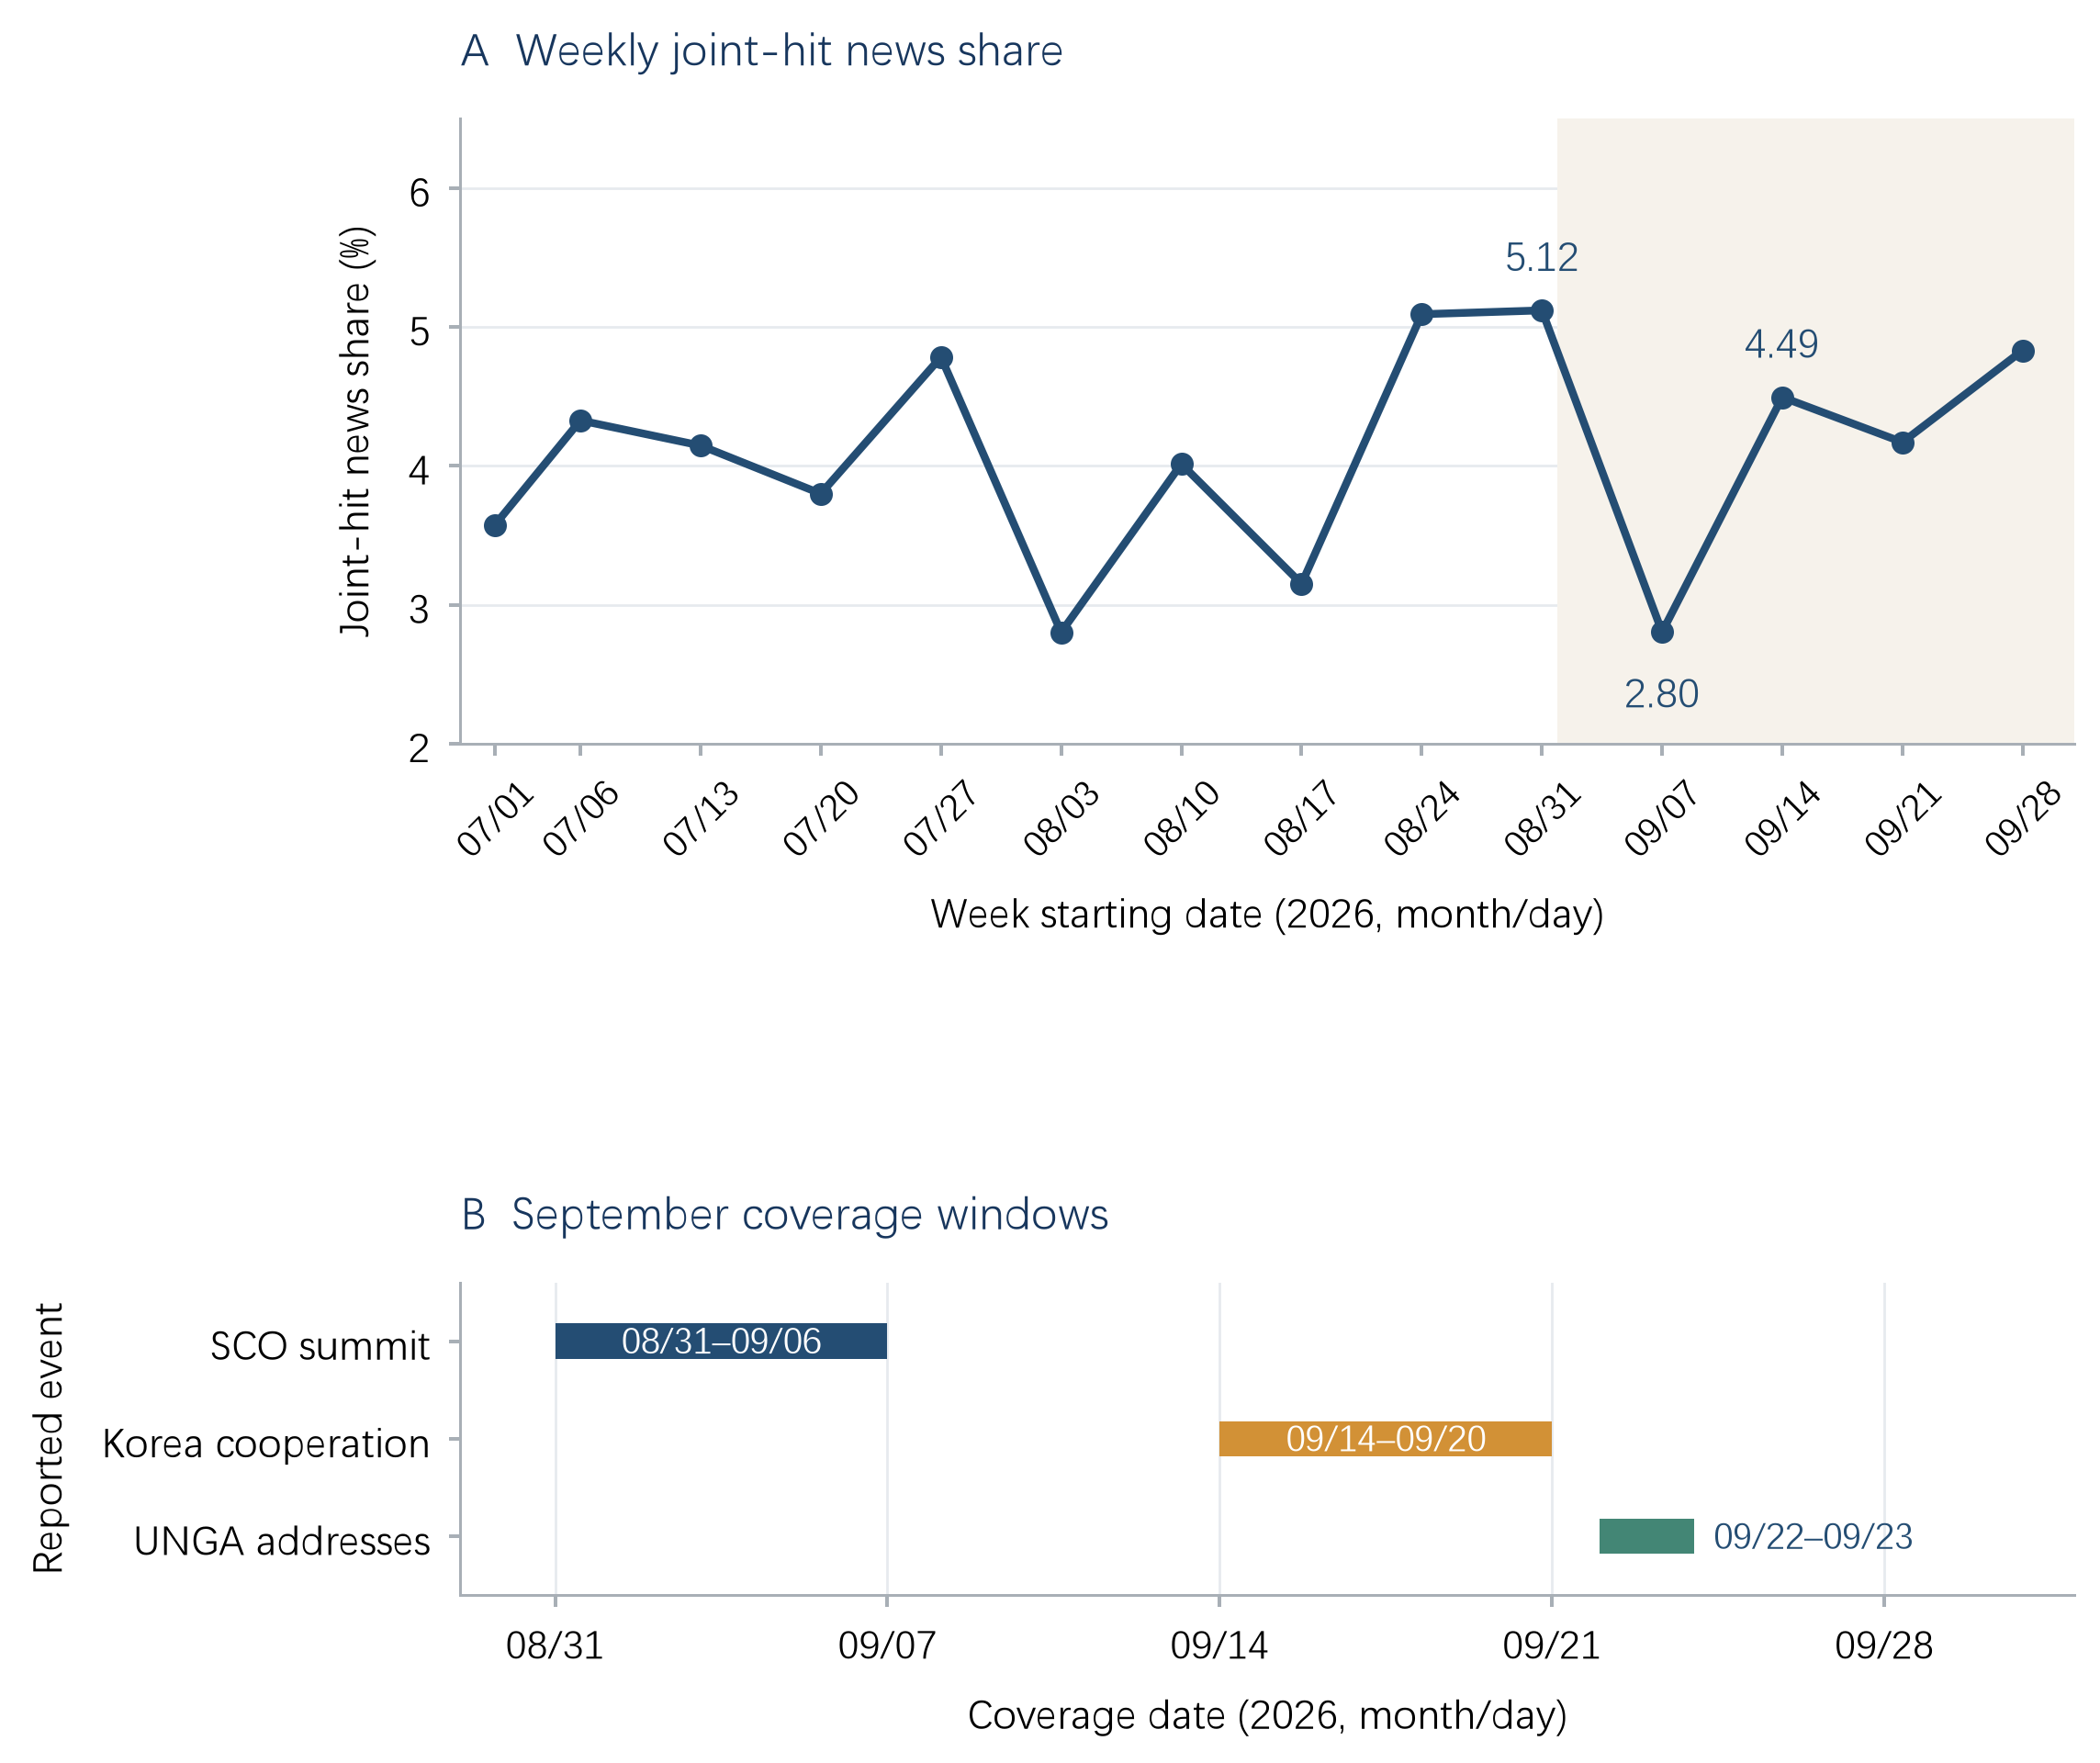
Each week is calculated from the actual news records. Event markers indicate the periods when relevant coverage appeared. July 1–5 and September 28–30 are partial weeks, so their record counts are not directly comparable with complete weeks.
Of the 60 joint-hit records in August 31–September 6, 11 explicitly referred to the SCO in their titles, a share of 18.3%; only 1 did so the following week. Similarly, 10 of the 56 records in September 14–20 referred in their titles to cooperation with South Korea or Seoul, accounting for 17.9%. Both event groups represented substantial shares of their respective weeks' coverage and coincided with relatively high weekly joint-hit proportions. By comparison, the September 30 dual-use draft appeared in only 1 sample record. It cannot explain the July–August pattern and is insufficient to account for the overall September increase. Its potential effect on fourth-quarter transaction processing depends on how the draft is finalized and implemented.
The points identified for monitoring in the second-quarter report yielded clear results this quarter. The three-month moving average did fall to 105.76. Uzbekistan's quarterly joint-hit proportion declined from 9.85% to 5.42%. The 'law' family remained relatively stable, but there was no simultaneous expansion in word frequencies across the trade, policy, and uncertainty categories. These results support the overall assessment of a decline from elevated levels and direct subsequent attention toward September's new developments and their persistence.
6. Fourth-quarter outlook: implementation, supply, and prices beyond the concentration of conference coverage
The fourth-quarter assessment should begin from September's 120.47, rather than the third-quarter average of 105.76. The index had already rebounded at the quarter's end, but much of the increase in word frequency was concentrated in conference coverage, long commentary, and media reviews. We expect concentrated reporting to subside after the conferences, with markedly slower growth in trade word frequency in October. If the index continues to rise, the more informative signals will be sustained increases in joint-hit records across several outlets and attention to new implementation measures over consecutive weeks.
Compliance issues in Kyrgyzstan are expected to persist. Checks on high-risk firms, changes in bank relationships, and list arrangements spanning the quarter have moved the discussion from general sanctions risk into implementation. The intensity of the issue in the fourth quarter should be assessed through specific rule developments: whether the common list is implemented, transaction documentation requirements are clarified, and the dual-use draft is finalized. A single address can quickly raise word frequencies; sustained coverage of implementation rules is more useful for assessing lasting changes in transaction conditions.
Fuel is another operating constraint that warrants monitoring across months. Third-quarter reporting evolved from supply shortages to procurement prices and then inflationary effects. If supplies remain disrupted in winter, discussion will intensify again and may extend to transport and other goods' prices. If supplies recover while procurement prices remain high, cost pressures are more likely to persist as shortage coverage declines. The next report should examine both supply and cost developments, retaining the distinction between reduced news attention and relief from economic pressure.
Subsequent coverage of regional cooperation is expected to move from broad cooperation objectives toward project implementation. September included initiatives for industrial and technological cooperation as well as specific projects and commercial agreements. Secured financing and implementation conditions will determine subsequent progress. Natural gas processing, critical minerals, and technology projects that first establish clear implementation arrangements will be more likely to generate sustained coverage. Attention to other issues will decline after the conferences.
Companion materials
This report is accompanied by a data transparency and reproducibility package containing 22 CSV files of aggregate data, a data dictionary, figures in Chinese, English and Russian, and scripts for verification and plotting. Readers can use these materials to check the reported statistics and reproduce the figures from the aggregate data. The package is available for download alongside the report. Download the data transparency and reproducibility package.
About the CA-TPU index
CA-TPU (Central Asia Trade Policy Uncertainty Index) was developed by Professor Lijie Zhang’s team at the School of Economics and Management, Xinjiang University. Based on the economic policy uncertainty methodology of Baker, Bloom and Davis (2016), it covers major Russian-language media in Kazakhstan, Uzbekistan, Kyrgyzstan and Tajikistan. The index measures the intensity with which mainstream media in these four countries jointly discuss trade, policy and uncertainty. It uses 2015–2019 as the base period, with the base-period mean normalized to 100, and is released monthly. Full methodological documentation, historical data and reports in three languages are available at catpu.caiees.cn.
This report is a non-profit academic publication with independent funding. It does not constitute investment advice or a basis for commercial decisions. Attribution: CA-TPU Index Project.